
Almost 70 years after Jane Jacobs’ arguments for smaller, mixed-use, connected neighbourhoods were published, the world is beginning to fully grasp the importance of neighbourhood-scale urban planning and actively supported service accessibility. If not already prompted by global sustainability agendas, such as the UN Sustainable Development Goals, the mobility standstill brought about by the coronavirus pandemic in early 2020 has provided a real-life simulation of what it would mean to live entirely within a few short blocks from home. Emphasis on the sustainability of the micro-neighbourhood grew as slogans such as the ’15-minute city’ and ‘walkable neighbourhoods’ gained the attention of mainstream media. In this context, the digital platform “Stories” acts as an open source and decentralized tool designed to engage citizens on urban initiatives/policies transforming the way they live and move around the urban context. Based on data-driven stories, the digital platform allows a two-way framework of communication between people and local entities, who can mutually collect and share -on a voluntary base – geo-referenced information. Stories is built on open source technologies – such as OpenStreetMap – allowing private and public stakeholders to freely fork, personalize and deploy their own place-based stories. In this regard Stories doesn’t rely on centralized data owned by private actors, but it is backed by aggregated and anonymous data. Offline capabilities allow the platform usage on areas affected by poor network connectivity.
This article was produced in collaboration with Accurat.
Using Urban Informatics to understand and respond to citizens’ needs
The explosion of location-based data and data collection tools in recent decades has led to a paradigm shift for urban and mobility planning. For the first time, movement patterns happening all around the city could be gathered passively at a large scale and synthesized in ways that give us insight about changes in mobility behavior in real-time. Not only that, but the ubiquity of geo-referenced data (in large part owing to digital miniaturisation) has led to the decentralization of data collection to billions of data sharers, significantly broadening the type and depth of movement data we can collect; a phenomenon we like to call ‘data in every pocket’ (Choubassi & Abdelfattah, 2020). Simply put, Big Data (and in particular location-based data) is transforming how we document, collect and understand mobility patterns. In the words of Batty, “This revolution in tracking human and other motion in digital form enables the collection of multiple attributes at the finest of scales of urban observation” (Batty, 2010, p. 576).
The discipline through which urban planners employ these technology-enabled spatial analysis methods has come to be known as Urban Informatics. Urban Informatics is an evidenced-based approach that, thanks to the recent development of advanced Information and Communication Technologies (ICTs) and the increasing availability of digitally widespread data sources, has led to innovative assessment tools and metrics that can provide valuable support to city decision makers (Foth et al., 2011). Due to unprecedented data volumes, granularity and diversity, problems of sampling bias associated with traditional data collection methods can be sufficiently overcome, allowing the data to be manipulated to focus on specific communities, their behaviors and needs (Batty, 2013; Milne and Watling, 2019).
It is within this framework that this project is conceived. Conceptually speaking, Urban Informatics operates at the intersection of three domains: People, Places, and Technologies. The Stories App project is the brainchild and execution of two entities: Systematica, an expert mobility consultancy that has long occupied itself with the domain of Place using both a human-centered approach and a data-driven approach, and Accurat, a leader in the field of Data Science and data visualization, with a deep-rooted philosophy of ‘Data Humanism’ (Lupi, 2017), which is an approach that attempts to deliver data to people in tangible and approachable ways. In that sense, the Stories project is one that combines the expertise of two industry experts into a multi-disciplinary approach to reimagine urban mobility as a customized, simplified and humanized daily experience.
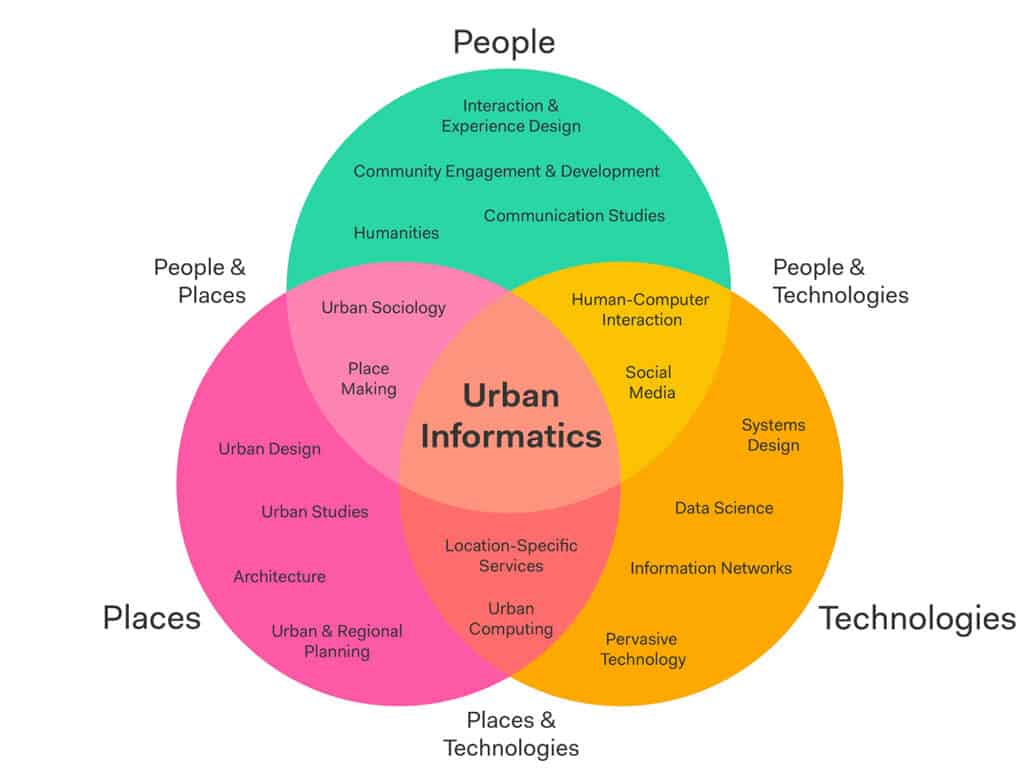
(adapted from: https://research.qut.edu.au/designlab/groups/urban-informatics/)
Despite recent efforts towards sustainable and inclusive mobility in urban contexts, the needs of vulnerable city users are still largely overlooked and/or not explicitly addressed through mainstream planning instruments. As highlighted by the 2030 Agenda for Sustainable Development adopted by all United Nations Member States (i.e., SDG 11.2-Sustainable Transport for All), public transport should be designed to be inclusive of diverse types of users: “By 2030, [transport systems should] provide access to safe, affordable, accessible and sustainable transport systems for all, improving road safety, notably by expanding public transport, with special attention to the needs of those in vulnerable situations, women, children, persons with disabilities and older persons” (United Nations, 2016, p. 24). A user-centered approach to mobility planning is central to the Stories App vision. Customized transit planning is etched into the DNA of the project with the aim to ensure transport inclusivity and promote equal access to opportunity in the city.
How Covid-19 impacted urban mobility and everyday life
The unprecedented disruption caused by the COVID-19 pandemic has given rise to a large cultural and technical debate on upcoming forms of urban development and mobility, in the attempt to envision potential trajectories of new paradigms and keep up with the pace of our changing cities (Transform Transport, 2021). City administrations around the world are recognizing walkability, universal accessibility, public realm and living locally as crucial planning dimensions. In particular, the recent focus on the ’15-minute city’ model represents a new perspective for evaluating sustainable, inclusive, and resilient urban organisms, meeting the human desire for community and place identity. The model envisions access to the urban life experience, e.g., essential facilities and services, in a timeframe of 15 minutes from home, by walking or cycling, as defined by Moreno et al. (2021). The recent pandemic clearly showed this potential as soft mobility modes were allowed for social and recreational life even during lockdown periods.
Having said that, encouraging the shift towards a sustainable urban mobility with focus on public transport, shared-micro mobility, and active modes such as walking and cycling is one of the main challenges European cities nowadays have to face (Buhrmann et al., 2019). Among all possible urban challenges, a recent focus on walkability, which contributes to the quality of life of its citizens by enhancing physical activity, well-being, and social inclusion (Speck, 2013) is shaking all advanced urban planning activities. Taking up this challenge, cities worldwide are improving pedestrian mobility, including barrier-free and safe sidewalks, but also human-scale environments which allow people to enjoy walking and gather in comfort (Gehl, 2013).
One of the main goals of European cities is to promote active modes of travel providing Sustainable Urban Mobility Plans or SUMPs for short (Buhrmann et al., 2019). Within a short time frame and following the impact of the COVID-19 pandemic, city administrations have adopted and implemented short and long-term plans to redistribute vehicular road space towards cyclist and pedestrian infrastructure. Milan, a city that was hit hard since the outbreak of the virus becoming one of the early epicentres of the pandemic is nowadays one of the forefront cities embracing this approach, adding 35 kilometres of cycle lanes in the city center under its Open Streets plan (Comune di Milano and AMAT Agenzia Mobilità Ambiente Territorio, 2020; Laker, 2020). In Milan as around the world, initiatives showing clear aims to favour pedestrian movement and active travel options quickly rose to the top of local mobility agendas.
The Stories App
Stories is a platform built for place–based storytelling, comprising four components or “layers” of interactivity: Placement, Guidance, Analysis, and Engagement.
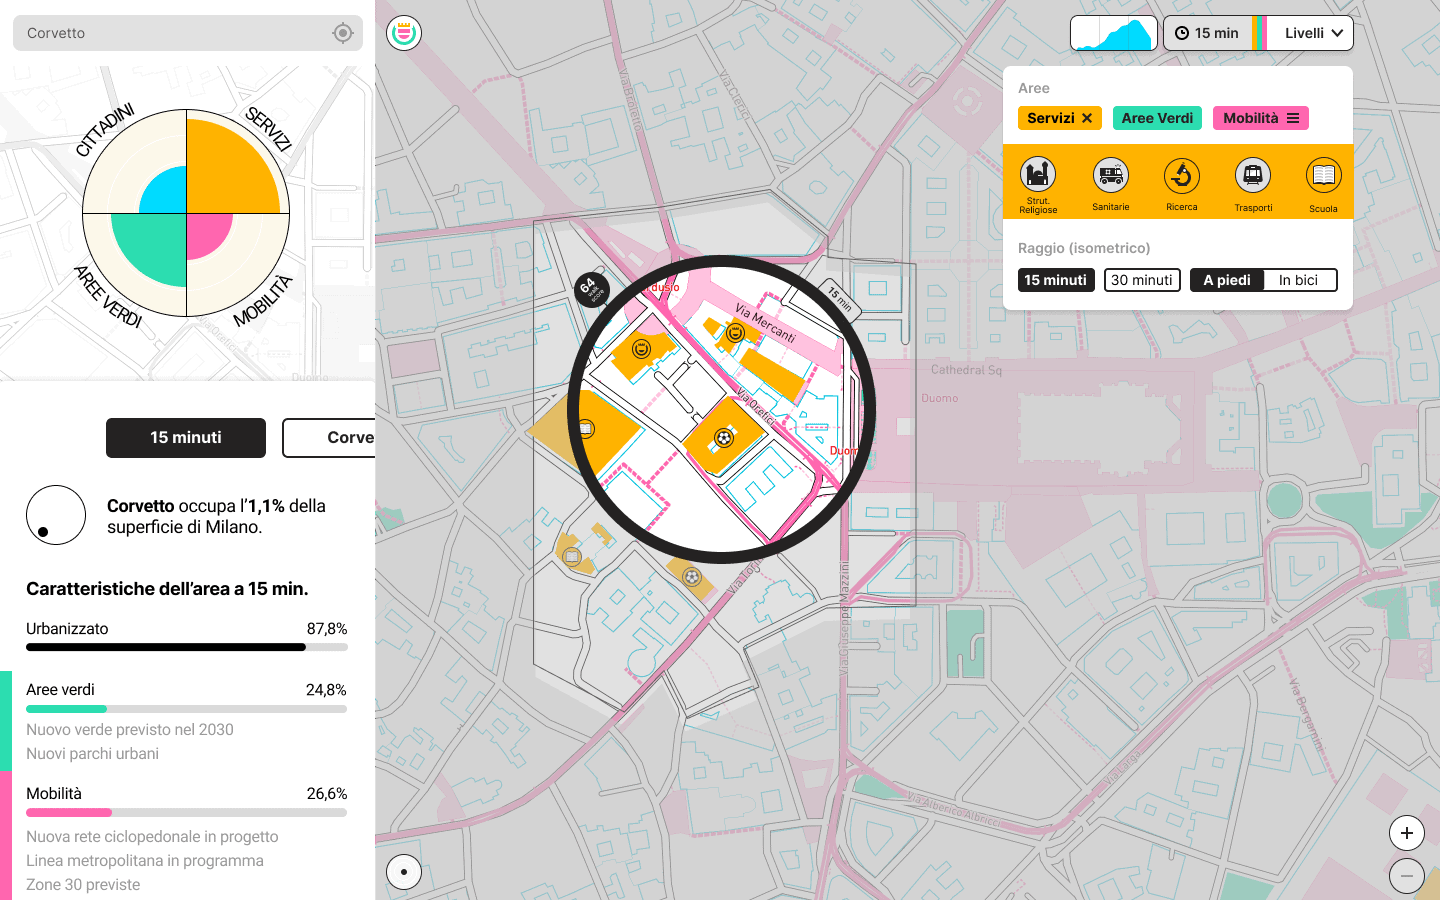
When users log in, they are greeted with a map of a locale marked by visual indicators. These icons show quality of life measures: proximity to green spaces, transportation, areas of culture and recreation, and demographics. The placement of these data visualizations shows the quality of amenities in the corresponding area across the four aforementioned categories. Users can customize Stories to reflect specific considerations. For example: the mobility category can be adjusted to only display bus lines, or bike racks. This visual system gives users an at–a–glance view of how well–suited an area is to meet their needs, whether they’re exploring as tourists or evaluating places to live.
After gathering their bearings, users are invited to take a tour by choosing a “Story” from a menu. In this example, the “15-minute-city” is the theme. When activated, the guided overview plays, taking users through the municipalities’ neighborhoods and highlighting places relevant to the Story via audio narration. The experience unfolds through a series of cards, which will feel familiar to users of Instagram Stories. Those who wish to deepen their exploration can do so with granular analysis capabilities, replete with data visualizations. Lastly, as a send–off, users are invited to participate through contributing tips to maintain the accuracy of data, or by simply signing up to receive notifications for new features and Stories.

Stories’ initial prototype was developed for Milan. Jacobs’ 15 Minute City served as a source of inspiration and a framework for ideating location–based narratives within the city (incidentally, the concept is also available as one of four options to activate the storytelling functionality). The app was designed as an alternative to tech giants’ map–based, navigational offerings, which are supported by (and thus, favor) local business interests.
Stories’ ethos—to put users’ needs first—is embedded into the prototype’s architecture. Open source, location–based data made available through the Commune di Milano’s geoportal powers this version, and represents a compelling use case. The prototype demonstrates how municipal data can be put to use as the foundation for a handy mobile app, equally valuable to locals and visitors.
At a higher level, the Milan prototype shows how Stories can be leveraged by local governing bodies to create a positive feedback loop for information–sharing. We anticipate that users who find the app valuable will, in turn, be more likely to contribute tips, ultimately improving the accuracy of city data. The end–product of this scenario is a strong, sticky offering, unique in its ability to serve sponsoring entities and users, both as a practical navigational tool and an ethical way to solicit data.
Open Data for Unlocking Hidden City Metrics
The methodological approach which sets the current research is based on the application of Geographic Information Systems (GIS) for the analysis of a series of relevant location-based data which were retrieved, sorted and filtered from the Geoportal of the City of Milan (2020).
According to the Territorial Government Plan of the Municipality of Milan (2019), the territory of the City of Milan is divided into 88 Neighborhoods or Nuclei of Local Identity (NIL): a system of areas connected by means of mobility infrastructures and services, and characterized by urban vitality, distinctive features, historical heritage, but also by ongoing renovation projects. Thus, NIL have been considered as the most appropriate spatial units for the proposed GIS analysis, in terms of historical peculiarity, granularity, average area.
The retrieved open data were used to design a series of multi-layered maps of the City of Milan, considering the territorial boundaries of the above described NIL. This was aimed at estimating the spatial distribution of each data set, and to identify and characterize the NIL where to prioritize interventions focusing on the accessibility of relevant services within a comfortable walking distance.
In particular, the selected datasets were analyzed considering the spatial distribution of punctual and areal vectors on NIL. For comparing the various indicators among them, each one has been normalized on a 0-100 scale, creating Z-scores that follow the normal distribution of the values. Data analysis started from the definition of four indexes, as follows: Demographics; Proximity services; Green areas; and Mobility.
The calculation of the Demographics Index was based on the density distribution (inhab/sqm) of the number of inhabitants living in the census sections of each NIL. The Proximity Services Index was based instead on the spatial distribution of social, religious, educational, security, health, administrative, and cultural services on each NIL. The Green Areas Index was based on estimating the aerial extension (sqm) of public parks and gardens on each NIL.
Finally, the considered dataset for the calculation of the Mobility Index spans several domains: (i) subway stations, railway stations, and local public transport stops (TP); (ii) cycling infrastructures (CI); (iii) sidewalk infrastructures (SI). This was based on estimating the number of inhabitants and workers served by transport services and infrastructures, and on the spatial distribution of cycling (m) and sidewalk infrastructure (m). Then, the index was defined by the weighted summation of the Z-scores of each data:

Through a preliminary sensitivity analysis on the considered data, the constant parameters KTP (corresponding to 0.8), KCI (corresponding to 0.1), and KSIS (corresponding to 0.1) were weighted to accentuate the impact of subway, railway and local public transport service on the proposed index (Σ constant parameters = 1).
The results of the analysis are then visualized considering both the proposed indexes and the possibility to explore the localization of each layer through an isometric buffer of 1 km, which approximately corresponds to 15 minutes by walking.
Users of Stories encounter the fruits of these calculations as objective scores, visualized within iconography that calls to mind navigational tools, such as a compass or sonar radar. The data visualizations—circular discs divided into four, color–coded sections—display an area’s performance across the four indexes. The consolidated visualization also allows users to easily weigh a location’s performance in one index versus another.
Scalability and integration of the app in future research projects
The research represents a preliminary step aimed at identifying the areas of the City of Milan where it is suitable to execute a series of data collection activities. In particular, neighborhoods characterized by a lack of accessibility of proximity services, green areas and public services and infrastructures could be further investigated through audit tools and survey questionnaires focused on the subjective evaluations of the city users about the level of walkability of a specific area.
One of the next steps will be aimed at transforming the results of the proposed in-depth data collection and analysis activities into an interactive communication tool, which could raise public awareness of the research findings. Thus, results will be exploited by using open-source platforms for data visualization to produce web-based, fully accessible and interactive thematic maps. Moreover, the app will include new functionalities related crowd source collaborative mapping through the direct contribution of the users, based on the possibility to incorporate feedback from the users and to collect data about their mobility patterns (Bolognesi and Galli, 2017).
Stories is built to scale to accommodate environments big and small, spread–out and dense. Its application is equally relevant to college campuses and metropolitan areas even bigger than Milan. Additionally, beyond opportunities in the public sector, Stories can be sponsored by private entities. The 2022 Olympics committee, for instance, could leverage Stories for the 2022 games in Milan and Cortina. Other types of companies that rely on users to self–navigate might find value in Stories’ potential for customization. Sponsors are invited to contribute expertise as material for audio narration. A museum seeking to highlight particular collection items, or a real estate firm looking to give users an overview of a neighborhood, are prime examples.
In conclusion, the study represents a valuable example of the possibility to analyze digitally widespread open data sources to support decision-makers. According to the 2030 UN Agenda for Sustainable Development (i.e. SDG 11.2-Sustainable Transport for All), the presented results could be of notable interest to public institutions involved in the design of sustainable and inclusive mobility strategies.
Acknowledgments
We thank Accurat for the fruitful contribution. The analyzed data were treated according to the General Data Protection Regulation (EU, 2016/679). The team thanks Comune di Milano and Agenzia Mobilità Ambiente Territorio for their support. This research received no specific grant from any funding agency in the public, commercial, or not-for-profit sectors.
References
Buhrmann, S., Wefering, F., Rupprecht, S. (2019). Guidelines for Developing and Implementing a Sustainable Urban Mobility Plan. Second Edition. Cologne: Rupprecht Consult-Forschung und Beratung GmbH. Available at: https://www.eltis.org/sites/default/files/sump_guidelines_2019_interactive_document_1.pdf
Batty, M. (2010). The Pulse of the City. Environment and Planning B, 37 (4), 575–577. https://doi.org/10.1068/b3704ed
Batty, M. (2013). Big data, smart cities and city planning. Dialogues in human geography, 3(3), 274-279. https://doi.org/10.1177/2043820613513390
Bolognesi, C. and Galli, A. (2017). Mapping Socials: A Voluntary Map of a Great Event in Monza Park. In Multidisciplinary Digital Publishing Institute Proceedings, 1(9), 917. https://doi.org/10.3390/proceedings1090917
Choubassi, R. and Abdelfattah, L. (2020). How Big Data is Transforming the Way We Plan Our Cities. FEEM Policy Brief, 20, 1-16. Available at SSRN: https://ssrn.com/abstract=3757431
Comune di Milano and AMAT Agenzia Mobilità Ambiente Territorio (2020). Milan 2020. Adaptation Strategy. Open Streets: Strategies, actions and tools for cycling and walking, ensuring distancing measures within the urban travel and towards a sustainable mobility. Available at: https://www.comune.milano.it/documents/20126/7117896/Open+streets.pdf/d9be0547-1eb0-5abf-410b-a8ca97945136?t=1589195741171
Foth, M., Choi, J.H.j., Satchell, C. (2011). Urban informatics. In: Proceedings of the ACM 2011 conference on Compute supported cooperative work, pp. 1–8. https://doi.org/10.1145/1958824.1958826
Gehl, J. (2013). Cities for people. Island press.
Laker, L. (2020). Milan announces ambitious scheme to reduce car use after lockdown. The Guardian. Available at: https://www.theguardian.com/world/2020/apr/21/milan-seeks-toprevent-post-crisis-return-of-traffic-pollution?CMP=Share_AndroidApp_Tweet
Lupi, G. (2017). Data humanism: The revolutionary future of data visualization. PrintMag. Available at: https://www.printmag.com/post/data-humanism-future-of-data-visualization.
Moreno, C., Allam, Z., Chabaud, D., Gall, C., & Pratlong, F. (2021). Introducing the “15-Minute City”: Sustainability, Resilience and Place Identity in Future Post-Pandemic Cities. Smart Cities, 4(1), 93–111. https://doi.org/10.3390/smartcities40100066
Speck, J. (2013). Walkable city: How downtown can save America, one step at a time. Macmillan.
Transform Transport. (2021). Shifting Paradigm: the impact of Covid-19 on transport planning. Systematica Srl. Available at: https://issuu.com/systematica/docs/covid19_sys_issuu
United Nations (2016). Transforming Our World: The 2030 Agenda for Sustainable Development. UN Publishing, New York.