

 How efficient are electric cars Well-to-Wheels? Energy efficiency of different technologies
Data source: Politecnico di Milano (2016)
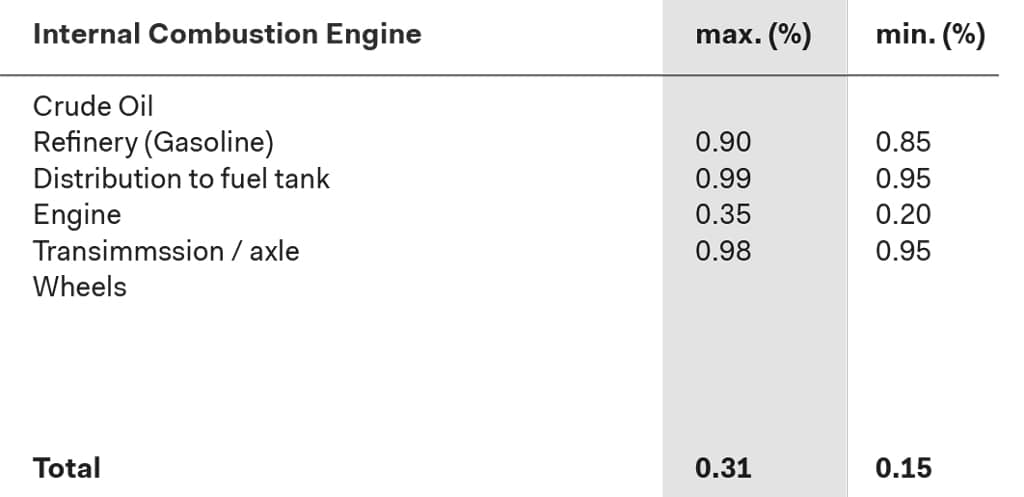
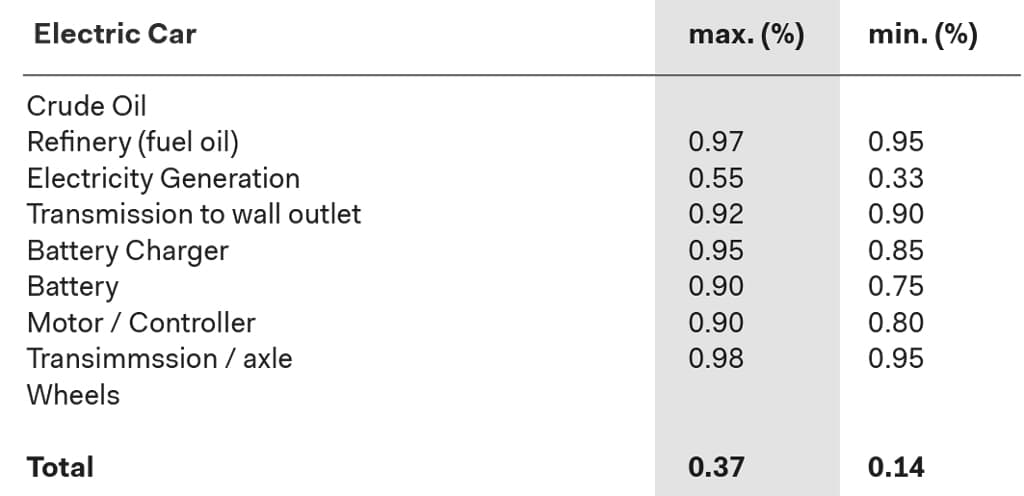
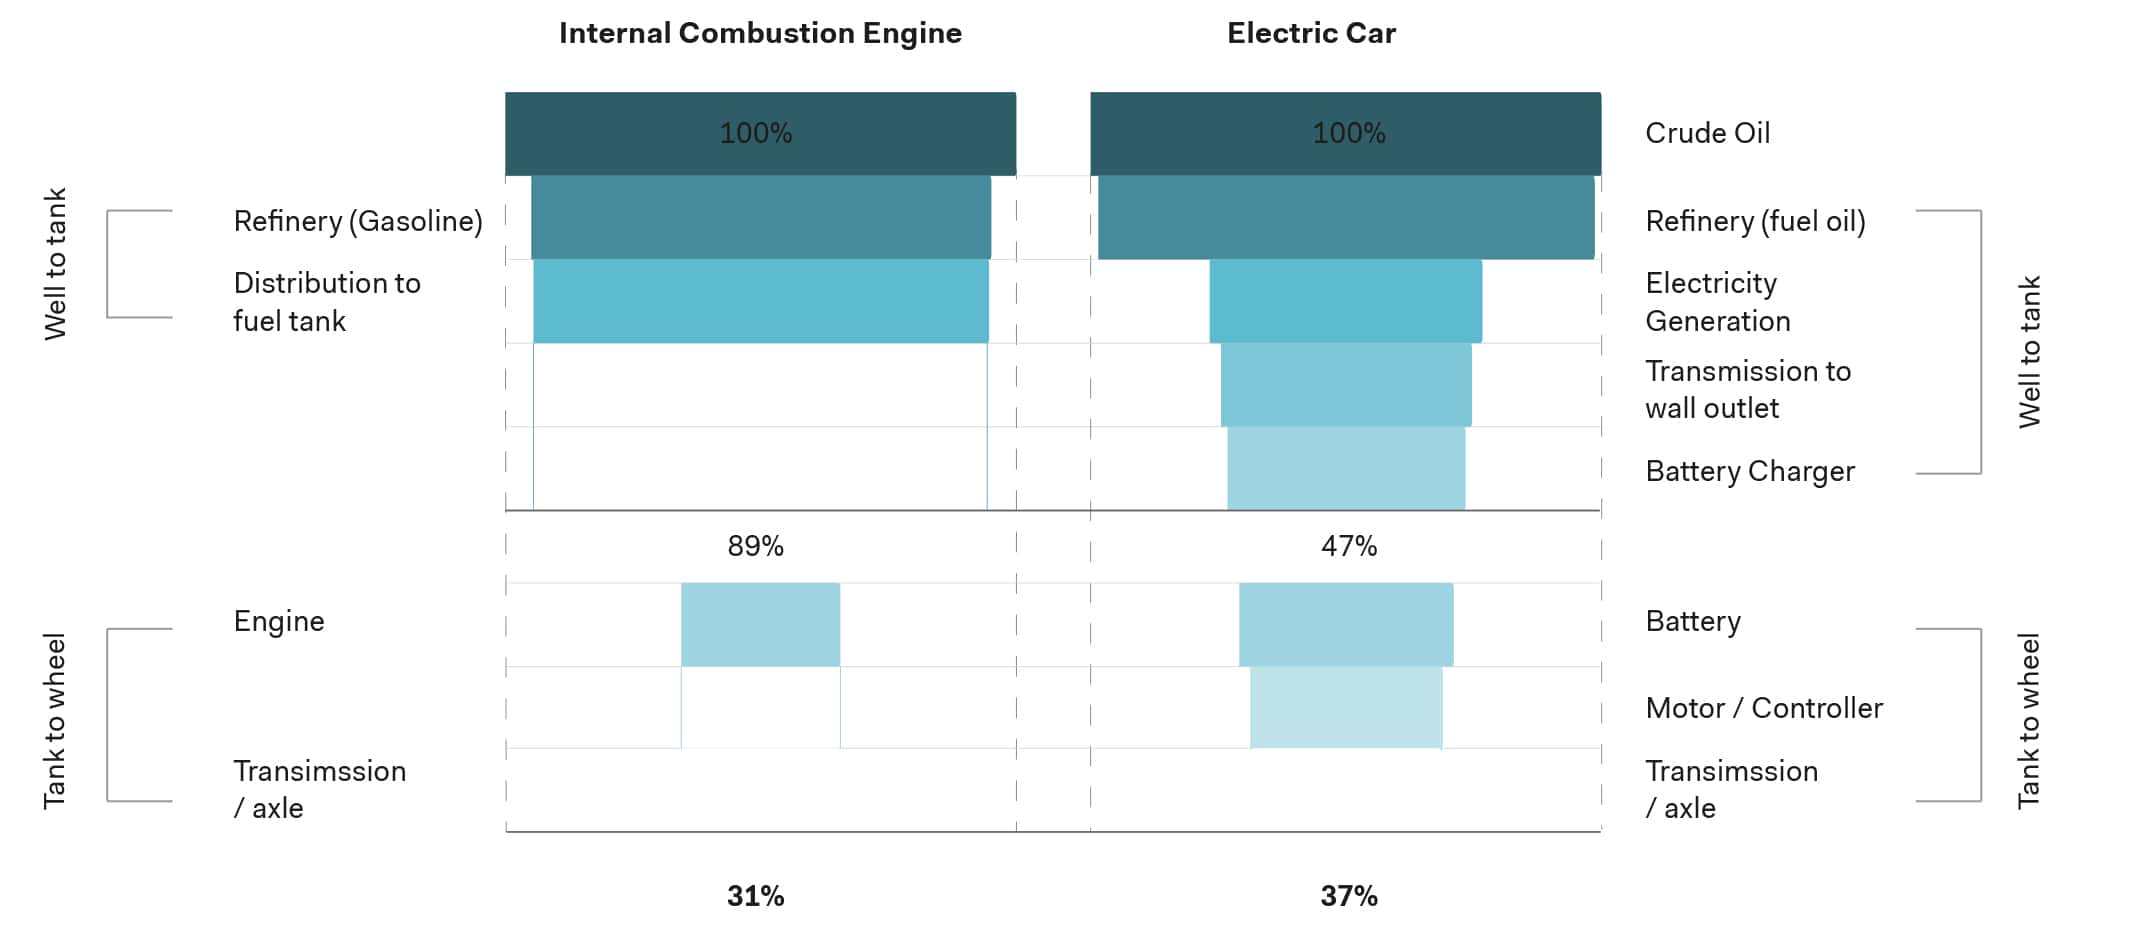 Well-to-Wheel efficiency, maximum scenario
Data source: Politecnico di Milano (2016)

Average vehicle emissions with Hawaii’s electricity grid

Average vehicle emissions with California’s electricity grid
Data sources: Union of Concerned Scientists (2019)
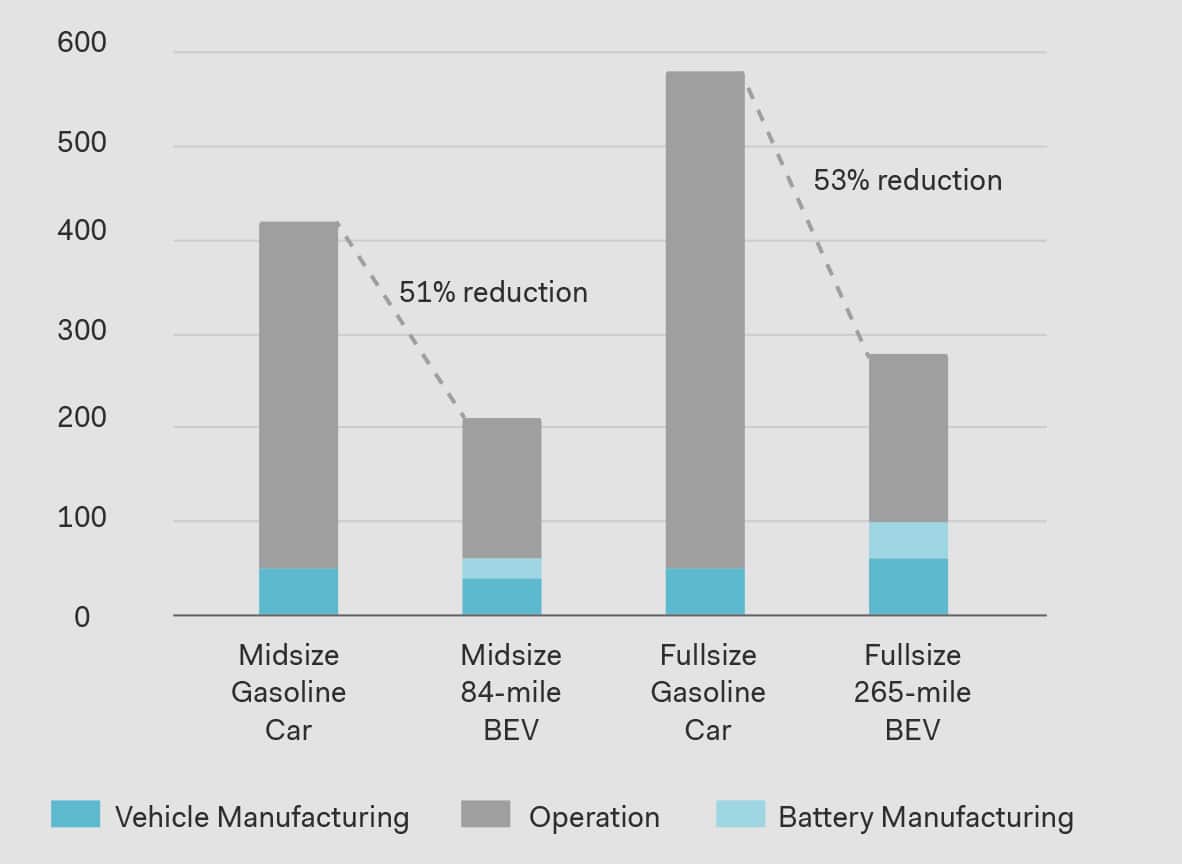
 Life Cycle Global Warming Emissions
(gCO2/mi – grams of CO2e per mile)
Data source: Union of Concerned Scientists (2015)
Different EV Outlooks (in million units)
Data sources: OPEC (2018), BNEF (2018), IEA (2019)
In the search for new ways to store energy, the most abundant element in the universe could give us a hand.
We used to think of electric vehicles as powered by batteries, but this is not the only way to store energy. Hydrogen has been strongly advertised for years by the supporters of the so called hydrogen economy, a concept where hydrogen substitutes fossil fuels for uses such as transportation and heating.
The benefits of using hydrogen as an energy vector are considerable: if burned it produces no toxic gases or CO2, but only water vapor, which is also the only by-product of hydrogen fuel cells. Its use in thermal engine, though, is not a good use of this resource: the combustion of one unit of mass would release more energy than a fossil fuel, but because hydrogen is a gas its extremely low density actually leads to an inferior energy release. The use of hydrogen in electric vehicles is a lot more promising. To harness its power fuel cells are used. These are chemical devices that combine stored hydrogen with oxygen from the atmosphere to generate electricity.
Fuel cells are a lot more convenient than batteries, as a tank can be filled in a matter of minutes. For this reason hydrogen would be even better suited for long-haul truck use. Being so heavy and needing to travel such long distances, trailer trucks must be equipped with considerably large batteries, in the order of 500 kWh or more. Even with the fastest chargers commercially available it would take hours to replenish an entire charge. Were an electric truck to be equipped with a Hydrogen fuel cell it would only need around 15 minutes to refuel. This makes the case for hydrogen more compelling for trucks.
The reason hydrogen is not widely in use already is that producing it requires huge amounts of energy. There are two main processes for that: steam reforming and electrolysis. The former extracts hydrogen from natural gas at high temperature, but the chemical process creates large amounts of CO2, while the latter uses electricity to separate water into hydrogen and oxygen atoms. Hydrogen production through electrolysis would work best with renewable energy, as it wouldn’t make much sense to generate electricity to produce hydrogen only to convert it back to electricity. [more]
The Strange Case of The Orkney Islands
One remarkable example comes from the Orkney Islands, in the north of Scotland. Electricity production there is already entirely renewable (wind, tide and wave) and, instead of switching off power plants, the local administration opted to harvest the extra energy and store it in the form of hydrogen. The power to do this is provided by community-owned wind turbines, which also do much to create jobs and fund local services. The stored hydrogen will be available at a later time for such uses as heating and transport. The project, named BIG HIT (Building Innovative Green Hydrogen Systems in Isolated Territory), is co-funded by the European Union and aims to demonstrate the scalability of this technology and the possibility to replicate it in other isolated or constrained territories.
Vehicles Consumption
A Database for Electricity Demand
A fundamental change within the transport sector which is the largest consumer of oil, 53.4% of overall consumption, is essential in order to transition towards a low-carbon economy. Since road transport is responsible for 76.5% of the oil consumption, a wide scale deployment of electric vehicles charged with electricity produced from renewable sources can significantly contribute to the reduction of green house gas emissions and air pollution in long term and improve resource efficiency.
In order to meet the extra electricity demand, additional electricity generation infrastructure should be considered on local, regional, and national levels.
The diagram is a result of average electricity demand from different data sources for different modes of transport.
Electric Vehicles Impact on Emissions
The green gas house emissions of electric vehicles will continue to be lower than conventional internal combustion engine vehicles, but the extent ultimately depends on the power generation sources. Research shows that emissions savings are significantly higher for electric vehicles used in countries where the power generation mix is dominated by low-carbon sources; on the other hand in countries where the power generation mix is dominated by coal, hybrid vehicles have lower emissions than electric vehicles.
The diagram is a result of average CO2 emissions from different data sources for different modes of transport.

Taking the conversation to a broader level we expanded the scope of the analysis to an entire urban environment. As a testbed for this study we designated the city of Milan. Taking advantage of comprehensive data from our transport models we ran a simulation to estimate the practical implications of a complete public transport fleet electrification along with a growing share of private electric vehicles on the roads over a fifteen years timeframe. The situation presented is a “now and then” scenario in which we compare two portraits of the same city at different points in time.
Our focus is on the environmental aspect of the electrifying process, with an eye on the consequences for the urban realm. In particular we are looking at CO2 emission reduction and an attempt at monetizing the deriving benefits. Because expressing environmental benefits in terms of tonnes of carbon dioxide is far from the average person’s imagination, this last step acts as a middleman in the process of translating a seemingly abstract concept into something easier to visualise.
Milan’s public transport network already enjoys a significant amount of electrification. As of now, thanks to four subway lines and tens of tram lines, 70% (ATM, 2017) of passenger movement is currently electric. Now all attention is focusing on the bus fleet, the only non-electric piece of the puzzle, with the local transport operator, ATM, going through a complete overhaul of its road vehicles. It aims to only operate electric buses, and therefore operate 100% electric, by 2030. The first steps have already been taken, with 50 battery electric buses on the road, new generation trolleybuses being delivered and orders in place to complete the rest of the fleet. The aim is to provide Milanese citizens with a cleaner and quieter means of transport. To top it all off, the company is buying solely renewable electricity.

Milan traffic model, traffic flow chart, Morning peak


Parking Guidelines
EV parking spaces require special attention to make sure they are easy to find and operate.
When electrifying a parking lot or garage some questions arise naturally, for example: how many chargers should be provided? Where should they be placed? What power should they provide?
Trying to answer these questions is a complicated task by itself, let alone if this were in a young and rapidly evolving market. Still, an answer must be found. To do that we put together a series of principles that constitute the good practice of EV parking design.
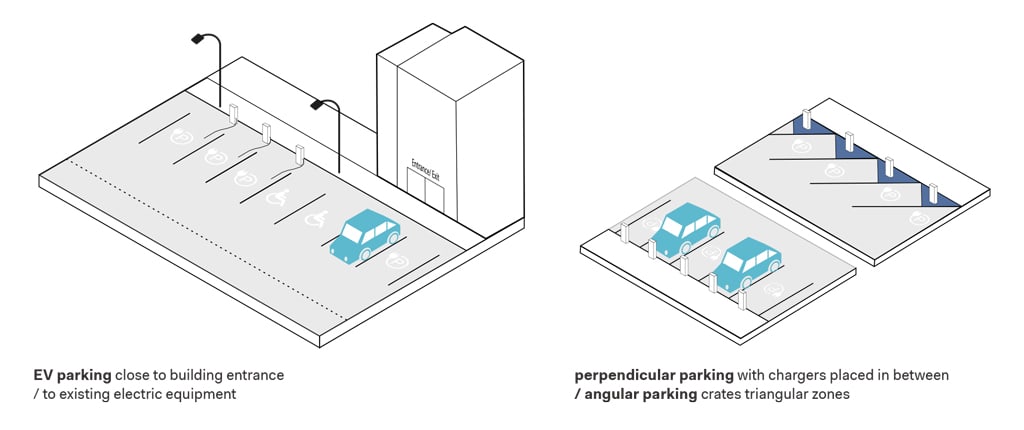
Where to locate them?
• To comply with disability requirements, EV parking places should be close to building entrance
• Protection from weather increases attractivity (indoor garage, solar panel canopy)
• To minimize installation costs, charging points should be clustered as close as possible to distribution cables and sources
• In perpendicular parking, chargers should be placed strategically to serve multiple vehicles and accommodate the vehicles’ different electric port positions
• Angular parking creates triangular zones between vehicle and curb than can be used to locate charger
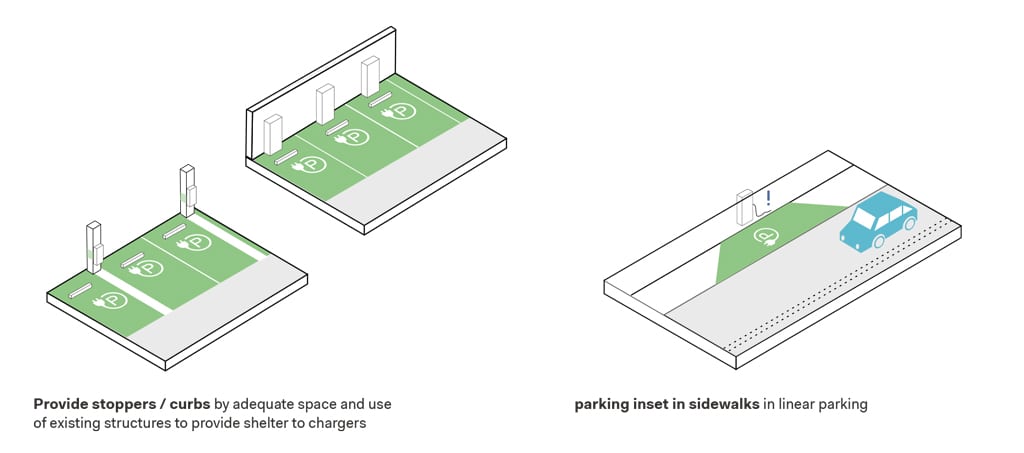
How to minimize obstacles?
• Adequate space should be provided to the user to handle the charger
• Casings must be considered to protect charger from the vehicles (wheel stops, bollards)
• Existing structures such as columns and pillars can be used to provide shelter to chargers
• linear parking, electric port on the vehicle might be on the traffic side, exposing user to increased risk – when possible, create parking inset in sidewalk
• Electric cords could create tripping obstacle to pedestrians – retractable or ceiling-mounted cables will solve the problem but at higher costs
How to get people there?
• Appropriate signage has significant impact on driver and pedestrian behaviour: green is to be preferred to indicate EV charging place, as blue is perceived as a general indication
• Concentrating all chargers in one area is preferable for the landowner as it contains costs. At the same time, having them in one area will make easier to be found by users (if proper signage is provided)

When is it enough?
Providing adequate parking infrastructure for electric vehicles is crucial in allowing them to become everyday objects. Several surveys show that the possibility to charge at home and at work plays a huge role when deciding whether to buy an electric car or not. Indeed, an EV owner would prefer to be able to charge anytime, anywhere. Perhaps one day all parking spots will be equipped with a charging outlet but for now, in the transition phase, the focus is on the most desirable venues. Whether electric parking places are built with electric mobility in mind or retrofitted they involve unignorable costs. Since they can only be used by EVs, finding the correct EV/non-EV ratio is paramount to avoid ending up with unused assets.
Electric vehicles perceive parking time in a different way than conventional vehicles: it’s no longer an inconvenience, but a chance to recharge some of the battery. They want to stay parked. The actual time that they spend parked is the first determining factor in deciding how much power to store: the longer the stop the lower the power needed. For cost reasons it would be desirable to install the least powerful chargers. At the same time fast chargers are more attractive to users. Finding the right balance is what this problem is all about. To further refine the study the average travelled distance can enter the equation: knowing how far users have to travel after leaving the facility can give guidance into how much power to provide in order to replenish the batteries enough to allow for the return trip.
Considering average commuting distances and driving habits, providing enough charge to travel 50 kilometres would be a reasonable minimum requirement. With a median fuel economy of around 0.2 kWh/km this translates into delivering 10 kWh of electricity to the vehicle. Once this parameter has been fixed, and knowing how long the average vehicle will stay parked, it is possible to install the correct power on order to obtain the desired result.
The final charger type allocation can be of only one kind or any degree of mix as desired. The chart below shows an example of how the overall investment would change as a function of the share of fast chargers in the whole parking. To keep things simple only two types of chargers were considered, fast and slow. What is interesting to notice is that with only a small increase in the number of fast chargers the total investment is doubled.
What is Sharing Micromobility?
The term micromobility generally refers to small personal mobility vehicles that are either owned or shared, electric or conventional. This section primarily focuses on shared electric micromobility systems that have taken over cities across the globe – particularly in the United States and Europe, and parts of Asia – in recent years. In essence, the term is used to indicate markets of e-bikes, e-mopeds and e-scooters.
These systems have diverse market growth trends, with the oldest being the sharing bicycle market, which began in Europe in 2001, while more recent introductions of e-moped and e-scooter sharing systems first emerged in the United States in 2012 and 2017, respectively.
The first wave of bikesharing began in Europe in 2001 when there were only 5 systems operating in European countries. Electric bike sharing is a more recent development that is gaining momentum globally due to its fast and flexible operations. As of 2018, electric bikes constituted about 10% of the sharing market.
The e-moped sharing systems market has grown globally at remarkable rates since 2015, more than doubling in 2019 worldwide. Today, 82% of moped sharing cities are in Europe with Spain and France being the European frontrunners. Outside of Europe, India established itself as the largest emerging market in 2019.
Scooter-sharing systems have achieved massive growth in just a few short years, the peak of which was in 2019. The year 2020 began on the prediction that the trend would ebb towards a consolidation of markets through acquisitions and increased regulation. Many countries were adjusting traffic laws to incorporate shared e-scooters, and many forefront cities, such as Paris were limiting the number of operators and fleet sizes in their cities (which in Paris had exceeded 20,000 in 2019). The developments of the global pandemic situation of course changed the tides on the entire market and as of the writing of this book, it was yet to become clear whether the micromobility market would survive this disruption, or in the most optimistic views, thrive because of it.
Short battery innovative cycles and the rise of sharing micromobility
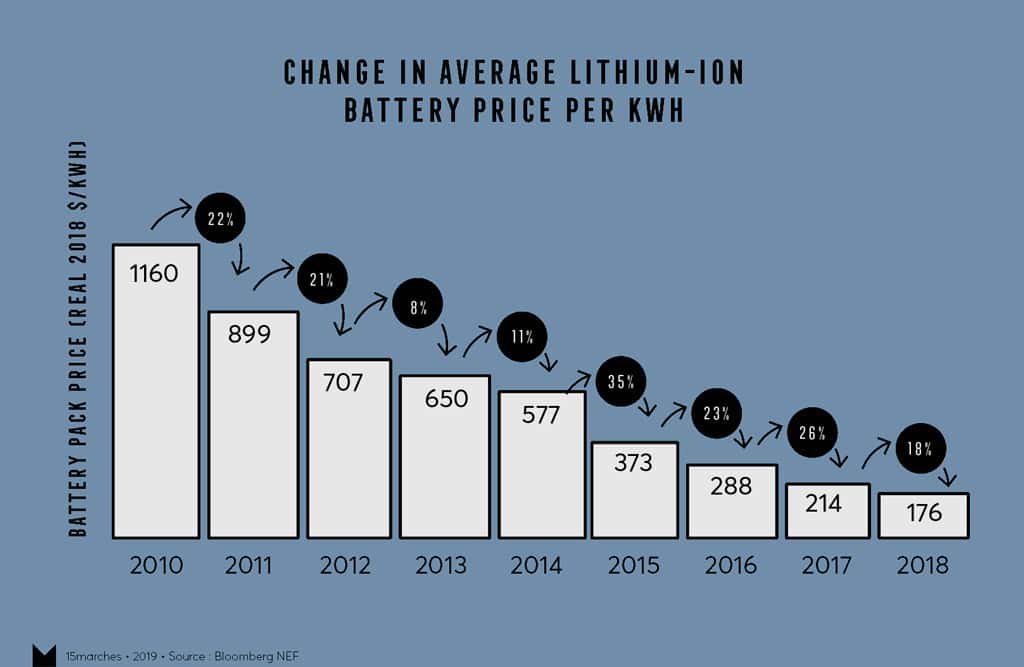
These market developments would not have been possible had it not been for the constant developments and price reductions of lithium ion batteries, which have essentially eliminated the industrial entry barriers of these devices and made it easier to travel faster with small physical and environmental footprints.

Operating Models
In a few short years, the number of electric micromobility sharing providers have multiplied across the globe. How do companies maintain price competitiveness?
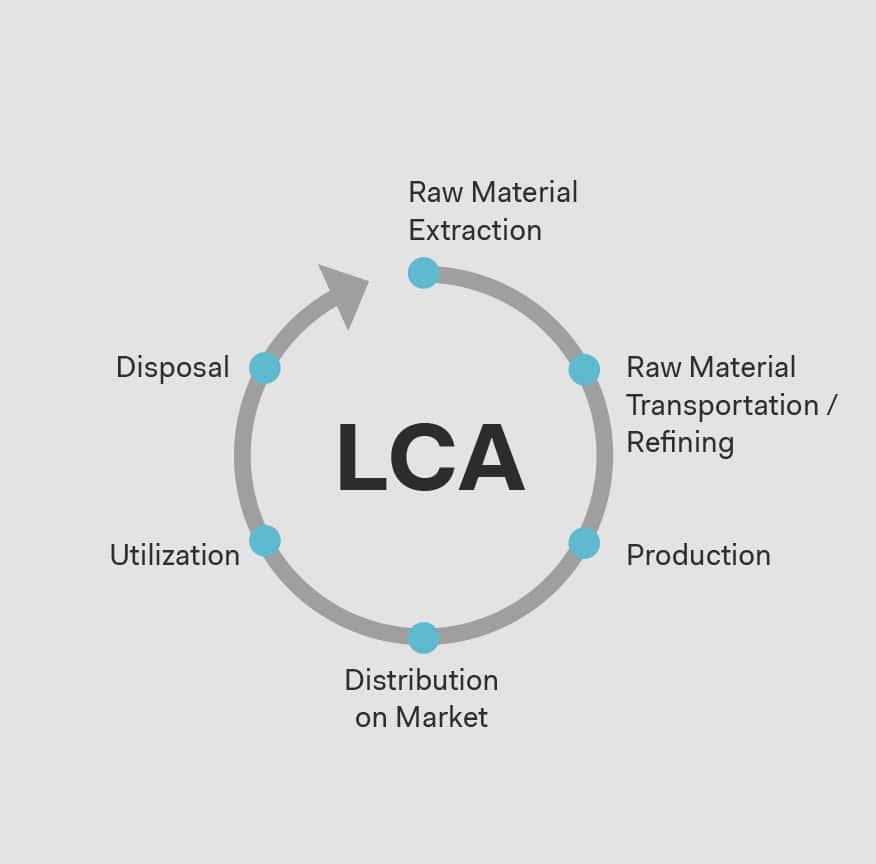
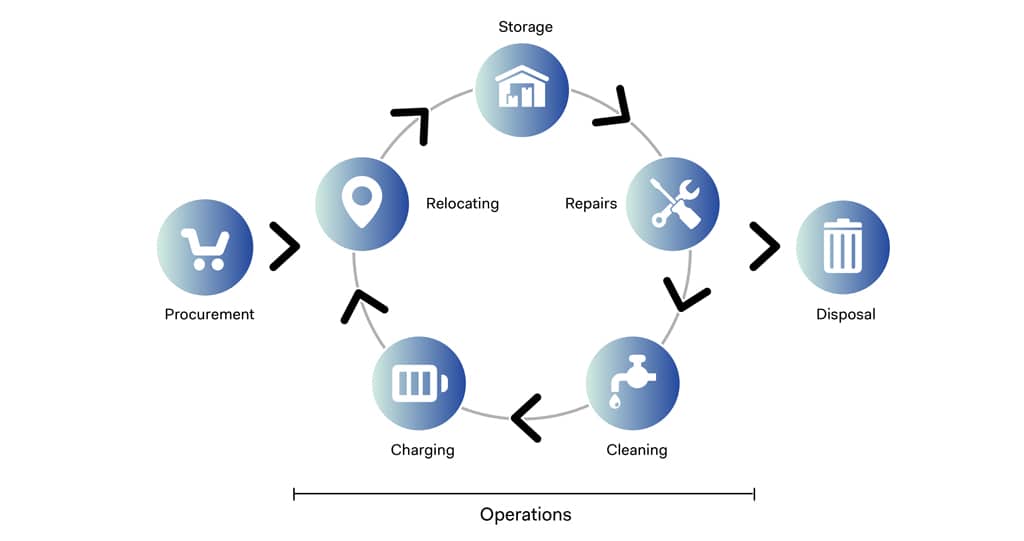
Optimising operations and the life cycle
Each device in an operator’s fleet undergoes the same life cycle; the aim of any operator is to extend the distance from procurement to disposal as much as possible, while making sure that each component in the operations phase is as efficient and economically and environmentally sound as possible. Each element of the cycle comes with its challenges. However, several studies of the electric sharing micromobility market have shown that Charging and Relocation are the most financially burdensome areas. These areas along with Procurement and Disposal are the most environmentally costly areas and have placed operators under a lot of public heat in recent times. Operators that are able to employ innovative strategies to reduce these mounting costs are spared a seat in the jungle.
Carbon Emissions
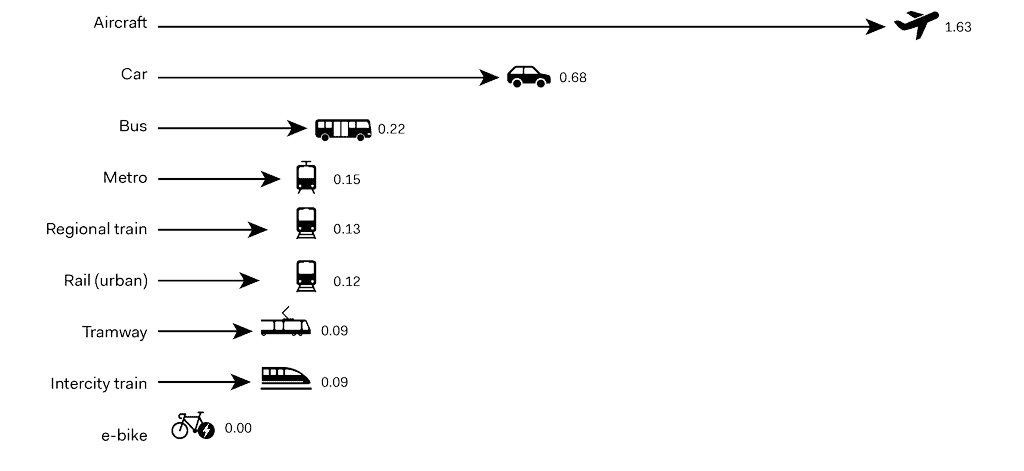
One of the driving forces of the micromobility movement has been centered around its low energy consumption per traveled kilometer in comparison to alternative private mobility vehicles such as the car. However, such analyses fail to take into account carbon emissions produced when the vehicles are at a stop, i.e. the enviornmental impact of the operational phases.
The following diagram comparing average carbon emissions by transport mode provides a breakdown of these emissions by category. We find that e-bikes, while they are slightly more costly than conventional bikes, are still fairly low on the scale, as are Vespa-like e-scooters (mopeds), which are significantly more environmentaly friendly that their gasoline-run counterparts. However, e-kick-scooters, and particularly in dockless systems, are high up the scale amid heavier and gasoline run vehicles. At a closer look, we find that the two main components driving up carbon emissions are maintenance, manufacturing and disposal. Given their short life cycles, vandalism and the oversupply of vehicles that come with dockless systems, it is no surprise that these categories drive up the negative economic impact of these vehicles.
![]()
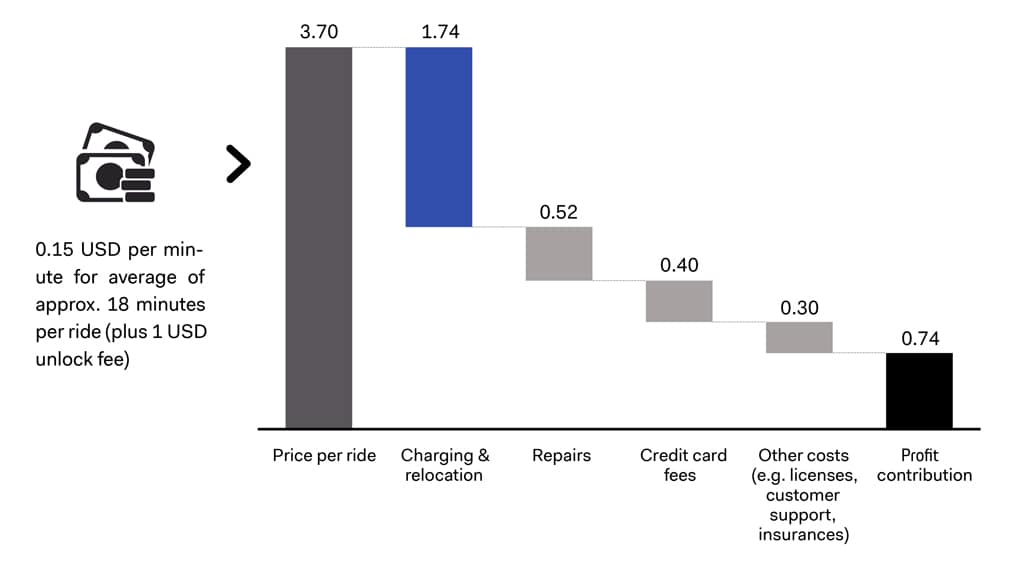
Operational costs
The unit economics of e-scooters give a sense of how costly charging and relocation activities are to an operating company. The analysis by Porsche Consulting shows that for every US dollar paid by the consumer, 47 cents go directly into operating these items. It is the single largest expense of shared scooter operations and makes up about 60% of total cost. As a result, a significant portion of the sector’s innovational capacity goes into developing winning models to improve the unit economics of these two elements. Some of these models will be discussed in the next pages. But first, a summary of the main operational types and the differences between them is essential.
 Charging Modes
How are sharing micromobility providers charging their fleets?

One of the pivotal areas in the operating model of sharing micromobility systems is charging. Unlike carsharing and other older models of shared electromobility, this market strategy relies primarily on the concept of reducing fixed costs, including infrastructure builds, which require great initial investments and lobbying efforts with host cities to approve station locations. Alternatively, crowd-charging models ranging from device pickups and delivery to off-site warehouses, and developing into the now-commonplace on-site charging by ‘juicers’ or hired personnel, come the advent of swappable batteries. Sometimes, this also includes relying on the gig economy or ‘crowd-charging’ models, as they are called to eliminate fixed personnel salaries. In the ever-evolving and still relatively volatile world of sharing micromobility, the keyword is risk reduction, should the operator have to pull out of a city or market suddenly. This is not a homogenous monolith. Naturally, each market operates on its own conditions and resources, and some alternative stories will be discussed in the case studies.
Battery Swap Stations
Some international cases shed light on the possibilities of alternative battery charging models that yield great benefits to the system. The success story of battery swap stations is one that relies on multiple co-factors, intrinsic and extrinsic to the model.
When it comes to motorized two-wheelers, Taiwan is an established powerhouse, with several leading home-based companies under its wing. Peak sale volume in 2017 reached nearly 1 million sold units across the nation. In 2018, a shift to alternative fuels led to a drop in sales and made way for electric scooters, which gradually took the market by storm. The fact that several policy schemes incentivize the use of electric scooters helped the market develop into what it is today, with more growth projected in the coming years.
The massive governmental support for electric scooters in Taiwan has led to the subsidization of the needed scooter infrastructure: user-based charging stations. Taiwan’s market is traditionally focused on the private market. Yet, leading companies such as Gogoro, which has already dominated the national private market are looking into extending a sharing service in several cities across the country as well. In this way, Gogoro could capitalize on their existing station network and circumvent the heavy toll of high infrastructure costs.
Taiwan: a robust battery station network

Policies & Regulations: a Global Patchwork
Around the world, the approach to sharing micromobility is varied: systems are either proactive, reactive or outlawed depending on local laws. The situation is constantly evolving and more and more global cities are updating their regulatory frameworks.
From March to November 2019, the number of European cities with shared e-scooter systems increased from 32 to 112. By March of 2020, this number had reduced slighting to 97 cities due to several retractions, yet the overall growth is undeniable and the rate of adoption is high relative to just 12 months prior.
Elsewhere in the world, the adoption of shared micro-mobility is also growing. Since the early onset of these new modes, debate has been fueling over their safety, their environmental impact and their place on the urban streetscape. Naturally, the openness to these schemes has not been the same everywhere. Depending on the rigidity of existing traffic laws, the openness of local markets to new, unpredictable modes of transport and local perceptions towards them, the course of action has been very different. As of the beginning of 2020, e-scooters are not yet allowed on Dutch and British roads. For the countries that do allow it, the process to organize roadspace, parking and riding rules, etc. is a long one. It will take time to establish new laws to regulate these vehicles, ensure optimum serviceability to the public and integration with overarching transport networks.
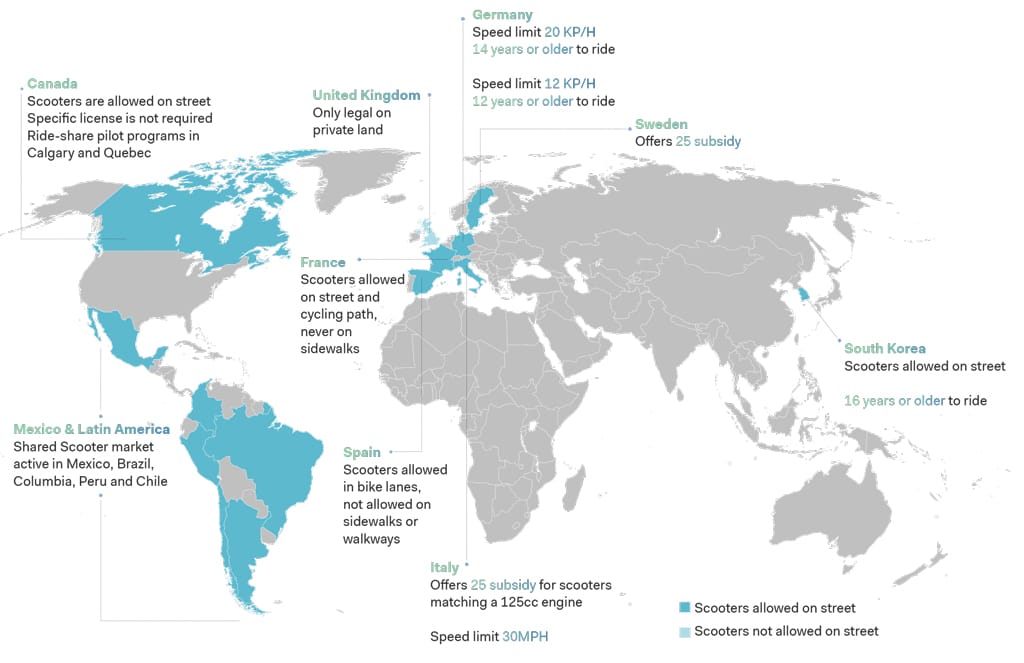 Electric scooter legal frameworks in various countries globally (2019)
(Data source: Unagi Scooters blog)