
Abstract
The spread of e-scooters in urban regions as a form of shared micro-mobility or last-mile mobility has been impressive in the last few years. As an example, between December 2019 and September 2020, shared e-scooters have increased, in Italy, from 4900 to 27150 units (according to Osservatorio Nazionale Sharing Mobility). This corresponds to a growth which is equal to 554%, in less than a year and during a global pandemic. This innovative means of transportation has provided advantages considering the possibility to decongest traffic volumes and reduce the emission of pollutants. However, it has also brought the necessity to better design and plan transport infrastructures to reduce the increase in the number of road accidents involving riders of e-scooters with pedestrians, cyclists and drivers of 2-4 wheeled motorized vehicles. In this framework, the current research work was firstly aimed at executing a thematic review of the most relevant scientific contributions present in the literature about the phenomenon, which highlighted the impact of environmental, technical and individual factors on e-scooters accidents. Then, the research was aimed at investigating road safety issues by focusing on the analysis of a location-based dataset related to the e-scooter accidents that occurred in Milan from June 2020 to February 2021. After describing the pattern of e-scooters trips and accidents within the considered time period, an extended GIS-based analysis was executed in order to merge this data with other spatially distributed indicators (taking into account the spatial autocorrelation of the considered variables), as follows: (i) socio-demographic data (such as population and workers density); (ii) land data (such as the distribution of urban fabric ); (iii) and mobility data (such as the diffusion of cycling paths or public transport). The objective of the analysis was to build a Suitability Analysis Index that could identify the most dangerous areas of the city for the occurrence of road accidents involving e-scooters. This was finally aimed at supporting public authorities in the design of safe infrastructures for the users of the service.
Introduction
According to a national regulation promulgated in Italy in the early 2020 e-scooters are currently classified as equivalent to bicycles and, due to this particular aspect, they aren’t subjected to particular regulations (e.g., homologation, vehicle registration, insurance, etc.). These benefits, together with other factors such as incentives offered by the Italian Government for the purchase of them during the Covid-19 pandemic in 2020, have led to a massive increase in the number of e-scooters circulating in Italian cities, without forgetting the large number of sharing companies that allow renting them to move throughout the city. In addition to this, the electric propulsion system of e-scooters fits very well with the development of policies that are increasingly keen on sustainable mobility. E-scooters are also easier to carry away on public transport and, because of this, they are a quite practical solution to solve what are the most common problems associated with the so-called “last-mile mobility”. This expression is used to indicate all the distances that are too close to drive and too far to walk, remembering that these trips comprise a huge proportion of all the trips usually done by individuals. The massive diffusion of e-scooters, together with some peculiarities that could make this type of vehicle less safe if compared with others (as seen in the literature consulted in this research), has brought with it a not indifferent problem of safety, recalled several times by Milan’s institutions. To give an idea of the phenomenon’s dimensions, we can consider the fact that in the month of September 2020, in the city of Milan (AREU, 2020), one out of five road accidents has involved e-scooters.
In this framework, the research work was firstly aimed at executing a thematic literature review about this phenomenon, which highlighted the impact of environmental, technical and individual factors on e-scooters accidents. Then, an extended GIS-based analysis was aimed at merging a location-based dataset related to the e-scooter accidents that occurred in Milan from June 2020 to February 2021 with a series of socio-demographic, land and mobility data. The objective of the analysis was to build a Suitability Analysis Index that could identify the most dangerous areas of the city for the occurrence of road accidents involving e-scooters.
Literature review
The research was firstly aimed at executing a thematic review of the most relevant scientific contributions present in the literature about the phenomenon (see Table 1), which highlighted the impact of both environmental, technical and individual factors on e-scooters accidents. Literature about e-scooters safety has been concerned mainly with the typology of injuries that occurred to drivers. Many authors have in fact underlined which type of injury is most common between e-scooters riders (Stormann et al. 2020, Mukhtar et al. 2021), together with the description of individual characteristics associated with riders involved in accidents. In fact, young and male people seem to be the categories most involved in e-scooter accidents, and falling from the scooter seems to be the most common reason for injuries, more than a collision with other vehicles (Stormann et al. 2020, English et al., 2020).
When studying the safety of e-scooters riders, other authors have been focused instead on the technical characteristics of the vehicle, trying to understand, on one side, the behavior of e-scooters on the different surfaces of the city, underlining how e-scooter riders experiment more severe vibration events in comparison with bicycle riders, whatever the surface. On the other side, cinematic of e-scooters has been analyzed in details, with the peculiarity of the vehicle being characterized by small-diameter wheels as a rolling element and with the problem, common to other two-wheelers vehicles, of lateral motion related to balancing (Yang et al. 2021, Garcia Vallejo et al. 2020)
Other authors have instead tried to underline the possible relation between e-scooter accidents and the characteristics of urban environments, using GIS analysis in order to understand where the main part of accidents occurs (Zou et al. 2020, Byrnes et al. 2018, Shah et al. 2021). For example, the importance of sidewalks could be seen in Badeau et al. (2019), according to which the majority (44%) of e-scooter injuries occur on sidewalks. Similar results come from Shah et al, which found that most scooter crashes occur on the transition between the sidewalk and the roadway. Another study by Zou et al. (2020) states that e-scooter crashes are concentrated in major employment centers and commercial strips in urban regions analyzed in their study. Parallel results come from the study of Byrnes et al, whose evidence suggests that e-scooters crashes are mainly concentrated in downtown areas of cities or in universities’ ones.

Enabling Data
Difficulty in finding structured data about e-scooter road accidents was an issue in the first phases of this research. Luckily, for what regards the city of Milan in this case, georeferenced microdata has been collected by AREU Milano (Agenzia Regionale Emergenza Urgenza), an agency that handles the single European Emergency Number and, because of this, records emergency requests following the various types of road accidents, including e-scooter ones. The same problem occurred for road accidents’ data in general, which were obtained thanks to BikeItalia. Data about shared e-scooter density were instead proprietary data recorded by Fluctuo.
On the other side, analyzing the distribution of location-based socio-demographic, land and mobility indicators has been possible mainly accessing the geoportal of the City of Milan (Geoportale Comune di Milano), together with the Open Data site. Another source has been the Copernicus site, useful to analyze the composition of land use.
The list of indicators used in this research is listed in the table below:
Methodology
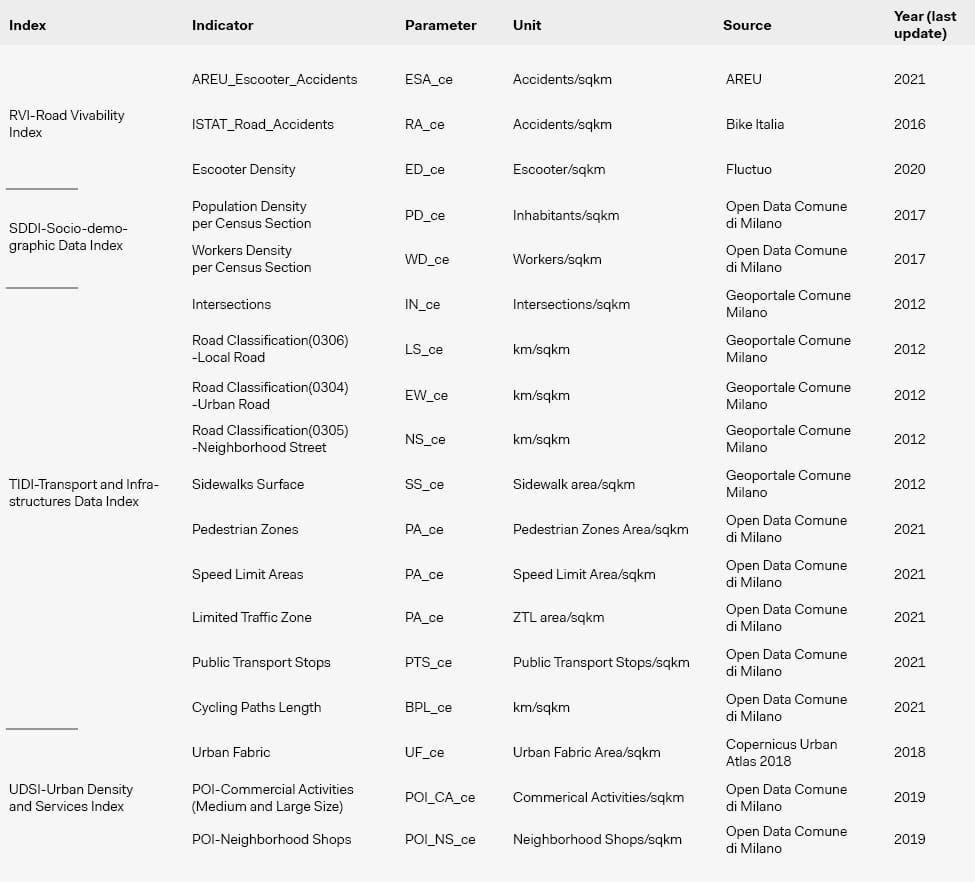
To assess the relationship between e-scooter accidents and the other indicators, we decided to use as a geographical unit the hexagonal grid proposed by Uber, that is Uber’s H3 grid. The choice of hexagons as a form of space division is justified by Uber saying that “hexagons were an important choice because people in a city are often in motion, and hexagons minimize the quantization error introduced when users move through a city. Hexagons also allow us to approximate radiuses easily”. So, the idea of using a hexagon as the cell shape is quite significant, simplifying various types of analysis. Starting from the Uber H3 grid, an extensive GIS-based analysis has been implemented in order to calculate the density of each indicator in every hexagonal cell of the grid (see Fig. 1). Three types of vectors have been included in the analysis: punctual, linear, and areal ones. For the purpose of comparing the various indicators among them, each one has been normalized on a 0-1 scale, creating Z-scores that follow the normal distribution of the values.
The following step has involved the calculation of a series of correlations (using Pearson’s Correlation Coefficient) between the normalized density of e-scooter accidents for each cell, and all the other variables used in this research, including the density of road accidents in general and the density of e scooter trips per cell. Only correlations significant at a 0.01 level have been considered in the analysis. The problem of accounting for autocorrelation of the variables included in this study was then considered by implementing a modified t-test using the function modified.ttest included in R’s packet SpatialPack. This modified t-test of spatial association is derived from the work of Clifford and Richardson (1989) and it is mainly based on the corrections of the sample correlation coefficient between two spatially correlated variables and requires the estimation of an effective sample size. The modified t-test helped to adjust Pearson’s correlation coefficients and the respective p-values, removing the variables whose p-value was no more significant if accounting for autocorrelation.
All the significant correlation coefficients were then included in the calculation of a Suitability Analysis Index (SAI). The index is built upon the idea that all the variables that show a significant correlation with the density of e-scooter accidents could help to locate areas of the city more “suitable” for the occurrence of accidents, in order to set up the first base for the development of future policies. The methodology behind the construction of the index is quite simple. In fact, SAI Index is essentially a weighted summation of the normalized density values of the variables used in this study, including only the ones that present a significant correlation with the density of e-scooter accidents, without forgetting to account for autocorrelation. The weight assigned to each variable depends on the value of corrected Pearson’s correlation coefficient. To be more precise, if the value of Pearson’s coefficient is quite low (r < 0.3), a weight of 0.05 was assigned to each value of the variable and, if the same coefficient is included between 0.3 and 0.7, a weight of 0.13 was chosen. This has been done so that the sum of the weights could have been equal to 1, considering that no correlation’s coefficient had a high value (r > 0.7).
Results
Starting from 5 June 2020 until 15 February 2021, AREU recorded 275 e-scooter accidents in the city of Milan, with a daily average of 1.08 accidents per day. The month more hit considering only the absolute value of accidents was the month of September, with 62 accidents recorded. If we consider the daily average, in September 2.07 accidents per day were recorded by AREU in the city of Milan. The less “involved” month was January, with 15 accidents recorded and a daily average of 0.48 accidents. This data, represented in the graph below (see Fig. 2), is obviously influenced by moving regulations during the various phases of the Covid-19 pandemic. Because of this, the most interesting aspect is probably the absolute number of accidents recorded, which can give us an idea of the dimensions of the phenomenon. Another interesting aspect is the difference between accidents occurring on the weekends compared with accidents occurring on weekdays. In fact, if accounting only for weekend days, a daily average of 1.01 accidents has been recorded, higher than the same number for weekdays, which is equal to 0.89.

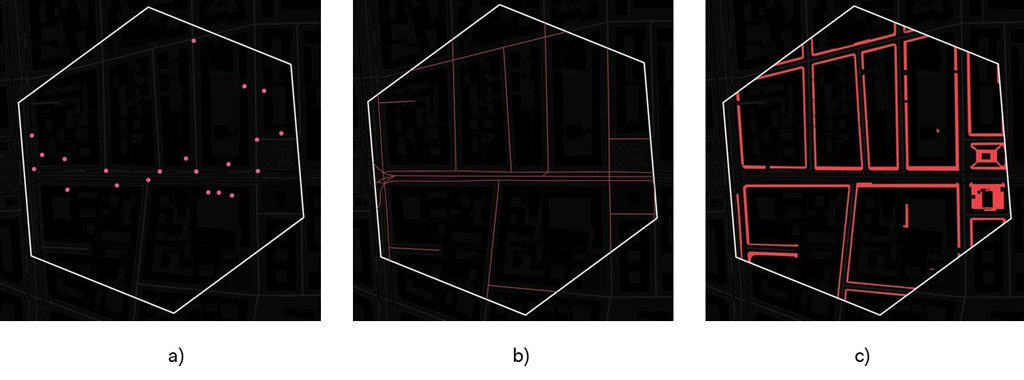
The spatial distribution of e-scooter accidents in the city of Milan is shown in the figures below (see Fig. 3 and Fig.4):
At first glance, the principal hotspot for what regards the spatial distribution of e-scooter accidents is located in the north-east part of the city, with a particular reference to Corso Buenos Aires, one of the principal thoroughfare of the city, in which 14 accidents have occurred (more than 5 % of total crashes). Not surprisingly, the hexagon cell with the highest number of accidents (which is equal to 5), is a cell crossed by the just quoted road (Corso Buenos Aires), with specific reference to the last part of it, just before becoming “Piazzale Loreto”. There are also two cells with 4 accidents that occurred: one is located in close proximity with “Porta Genova”, while the other is located just outside “Bastioni di Porta Nuova”.
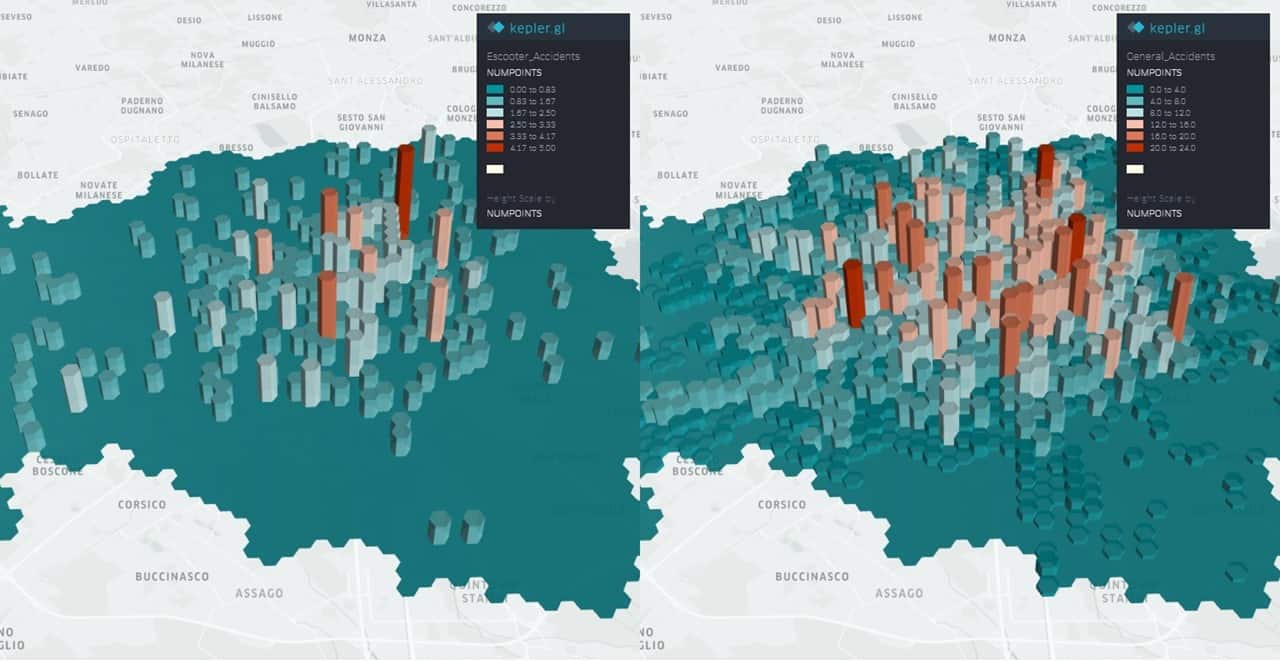
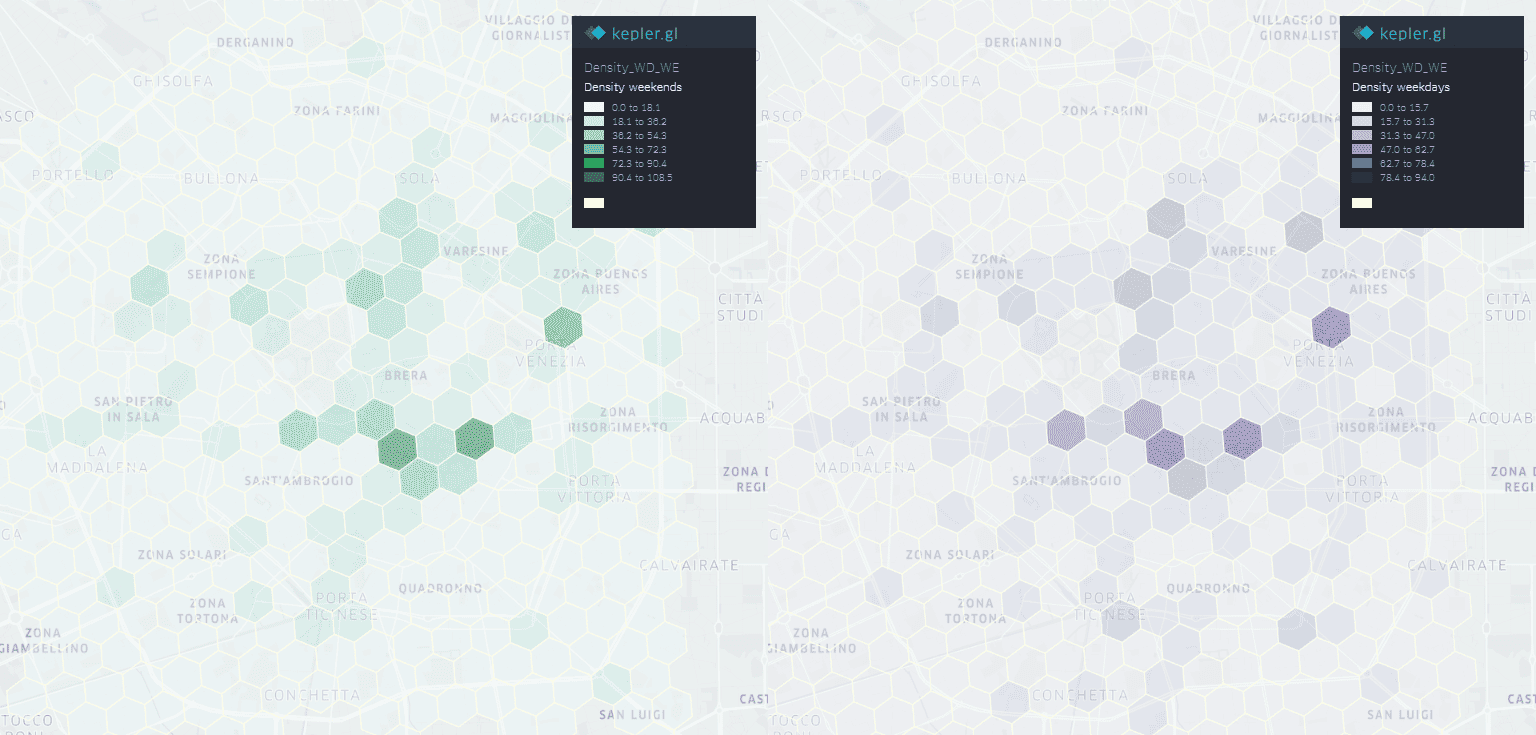
Opposite results can be seen when considering not anymore the density of accidents but the density of e-scooter trips per each cell, as it is possible to observe analyzing Fluctuo data (see Fig. 5). In this case, the average number of trips per cell on weekdays (14.20 e-scooters/cell) is higher than the same value for what concerns weekend days (13.46 e-scooters/cell). Looking at the map of the density of e-scooters trips has however confirmed the relevance of Corso Buenos Aires as one of the major thoroughfares of the city, with the cell with the highest volume of trips on weekdays (and the third volume on weekends) crossed by the just quoted road. In the latter case, the cell with the highest volume of trips on weekends is located in Cordusio’s zone, in close proximity to Milan’s Dome.
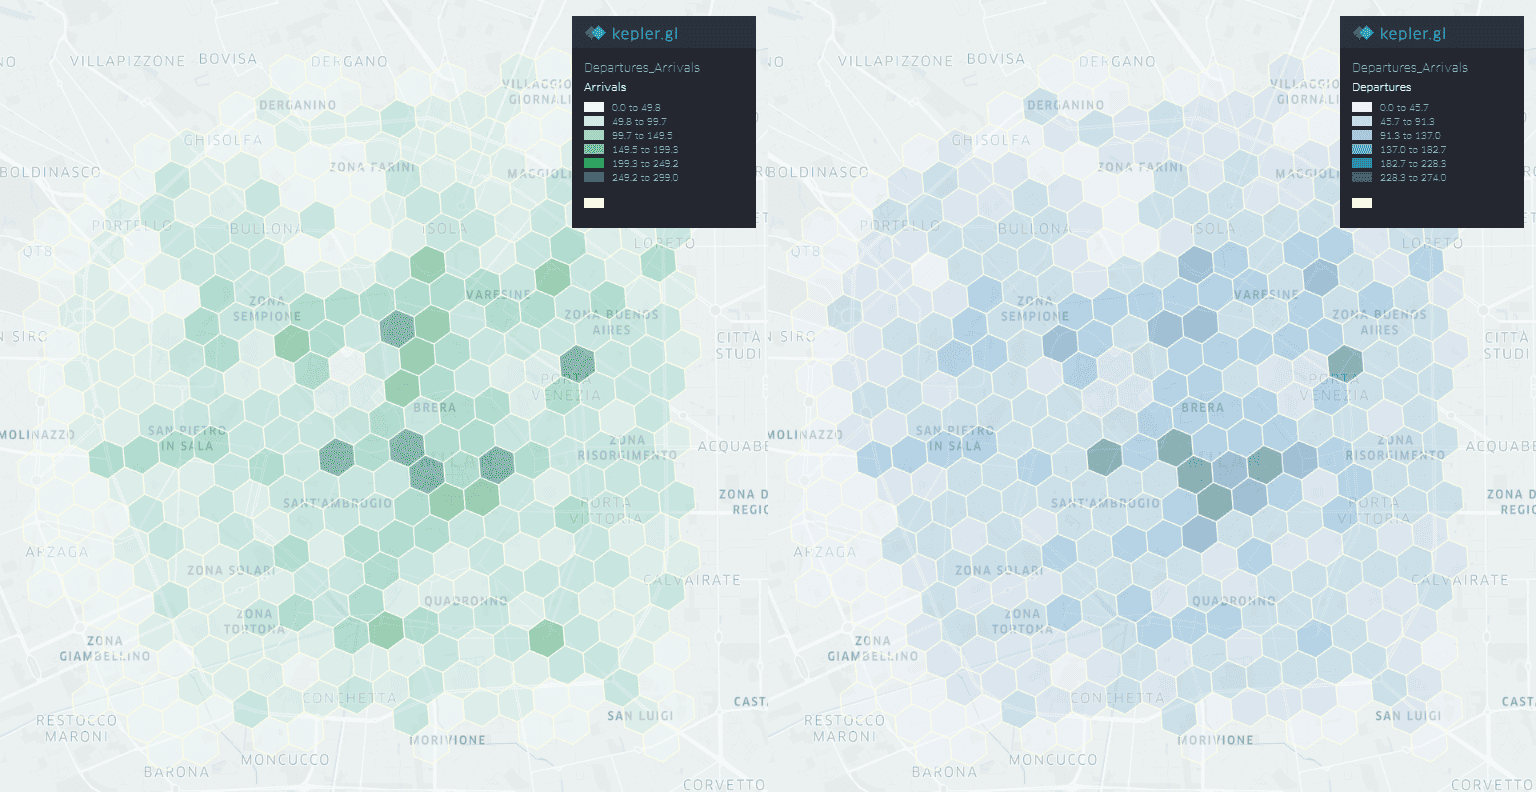
For what concerns the origin-destination matrix of e-scooter trips, unsurprisingly, despite the peculiar nature of dockless e-scooters, cells with the highest number of departures are at the same time cells with the highest number of arrivals (see Fig. 6). This aspect is particularly evident when observing the correlation coefficient between the number of departures and the number of arrivals per cell, which is equal to 0.993. Departures and arrivals of e-scooter trips are distributed in a quite homogeneous manner: in the 383 cells in which Fluctuo has recorded their data, the ones in the first decile of the cells ordered by the number of departures are responsible for only 19.8% of total departures. Similar results can be observed when considering only the number of arrivals: in this case, the same percentage is equal to 21.33%. The cell with the highest number of departures, which is, in this case, the cell with also the highest number of arrivals, is the cell that covers the territory in close proximity to Cordusio’s metropolitan station, opening a series of interesting questions.
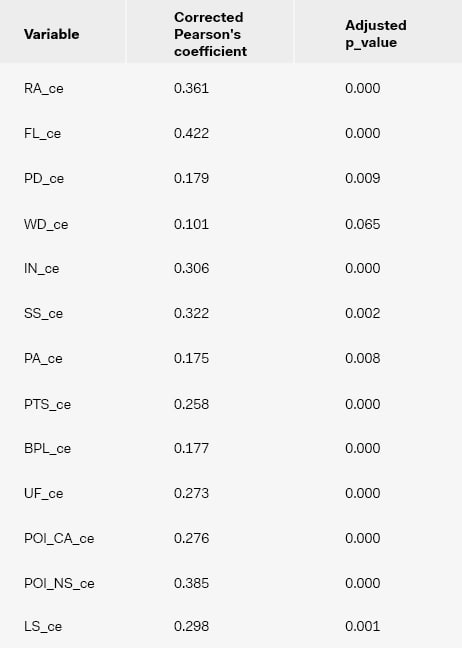
The second part of the research was based on a correlation analysis between the density of e-scooter accidents and the other variables included in the study (socio-demographic, land and mobility data).Results of correlation analysis initially showed, as represented above and in Table 2 (significance was assessed at the 0.01 level):
Moderate, positive, and significant correlations between the density of e-scooter accidents (ESA_ce) and the density of road accidents in general (RA_ce, r = 0.361), the density of sidewalks surfaces (SS_ce, r = 0.322), the density of road intersections per cell (IN_ce, r = 0.306), the density of neighborhood shops (POI_NS_ce, r = 0.385) and the density of e-scooter trips (ED_ce, r = 0.422);
Weak, positive, and significant correlations between the density of e-scooter accidents (ESA_ce) and the density of population per cell (PD_ce, r = 0.179), the density of workers (WD_ce, r = 0.100), the density of pedestrian areas (PA_ce, r = 0.175), the density of public transport stops (PTS_ce, r = 0.258), the density of bike paths (BPL_ce, r = 0.176), the density of urban fabric (UF_ce, r = 0.273), the density of medium and large commercial activities (POI_CA_ce, r = 0.275) and the density of local street (LS_ce, r = 0.298);
Weak, negative, and non-significant correlations between the density of e-scooter accidents (ESA_ce) and: the density of expressways (EW_ce, r = -0.042) and the density of neighborhood streets (NS_ce, r = -0.042).
These results don’t take into account the autocorrelation of the variables, which was then considered in order to adjust the results. The results of the modified t.test, as can be seen in the table below, led to the exclusion of one variable, the one related to the density of workers (WD_ce), due to his level of significance, which was no more suitable when accounting for autocorrelation.
This procedure led us to the construction of the SAI (see Fig. 7), as described in the methodology section.
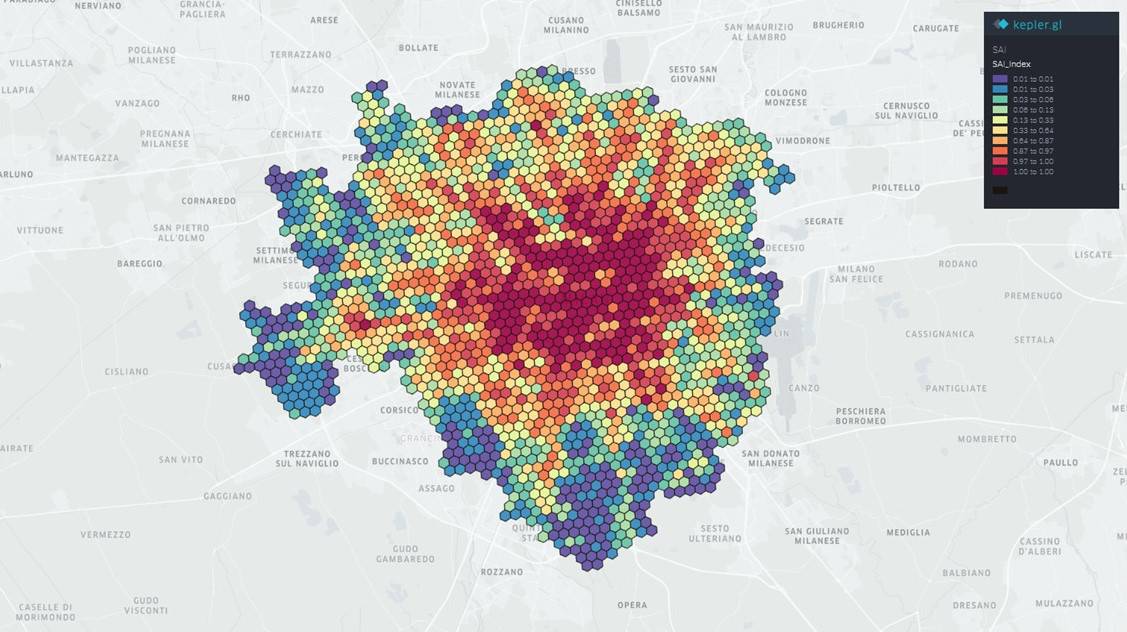
The map clearly shows a central core for what concerns the cells with a higher value on the Suitability Analysis Index, with only a few exceptions constituted by isolated cells just outside it. Two cases, in particular, show high values (they are both parts of the tenth decile in the distribution of values) combined with a massive distance from the center of the city. One is located in the western part of the city, next to Quartiere Valsesia, a neighborhood almost exclusively characterized by residential land use. The other one is located in the northern part of the city, in close proximity to Affori’s metropolitan station. A similar consideration can be done when considering the cell that crosses the center of Corvetto’s neighborhood, which presents a high value on SAI despite the distance from the center of the city. These considerations underline the importance of considering not only the “suitability” of central areas as potential locations of accidents but also the role of peripheral ones. Quite interesting could be the idea to study in-depth the aspect related to land use in relation to micro-mobility accidents, in order to verify a possible relation (for example), between the prevalence of residential land use (which characterizes some peripheral areas) and the presence of last-mile mobility phenomenons.
Discussion and conclusions
As mentioned in the introduction of the article, the SAI_Index map has returned an image of the cells more “suitable” for the occurrence of accidents with a clear predominance on the central zones of the city. In fact, when looking at the cells with a high value on the SAI_Index (SAI > 0.97), the pattern is quite evident. A few exceptions can certainly be highlighted (as mentioned before), underlining the importance of rethinking some peripheral zones. Still despite this, the importance of analyzing the geographical distribution of e-scooter accidents can’t be led back only to a center-peripheries scheme, as it was in part clear analyzing the single correlation coefficients. Having a moderate positive correlation between the density of e-scooter accidents and the density of sidewalks, for example, is certainly a quite interesting aspect, which corroborates what found in the literature consulted and which opens some questions about the use of e-scooters by individuals, starting from the fact that driving on sidewalks is forbidden by Italian laws. This aspect should deserve particular attention from policy-makers for the fact that, if e-scooter riders really drive on sidewalks, there is a possible problem of lack of dedicated infrastructures that could guarantee road safety to those who want to drive their e-scooters in urban areas.
Another relationship that deserves attention is the one between the density of e-scooter accidents and the density of road intersections. This relation recalls the importance of underlining the morphology of urban road networks when talking about safety issues, remembering one time more the central role of technical profiles in projecting urban circulation.
Another important aspect, which was quite marginal in this study, is the importance of analyzing the relationship between land use and safety issues. Knowing the reason that leads riders to use e-scooters in their daily lives (that is commuting or leisure, for example) is in fact fundamental to understanding where to intervene in order to avoid circulation problems, with a particular focus on e-scooters. This can be done using as a proxy the huge amount of information available for what concerns land use, whether it is commercial, residential, or industrial, opening a series of interesting research possibilities.
Last but not least, it could be quite interesting to study in deep the relationship between the typology of road and the density of e-scooter accidents, which was omitted in this case due to the presence of not significant results. The road hierarchy used in this study was in fact quite limited and didn’t include the description of some important road characteristics, without forgetting the importance of road surface, another aspect that could lead to explain the relationship assumed in this section. Future research will certainly be more focused on this aspect, so that it will be possible to better understand which typology of road is more problematic for the circulation of e-scooters.
Acknowledgments
The research work has been carried out in collaboration with Davide Tamiozzo and Prof. Matteo Colleoni of the Department of Sociology and Social Research of the University of Milano-Bicocca (Milan, Italy). The authors thank AREU for their fruitful collaboration and for sharing data. The analyzed data were treated according to the General Data Protection Regulation (EU, 2016/679).
References
Badeau, A., Carman, C., Newman, M., Steenblik, J., Carlson, M., & Madsen, T. (2019). Emergency department visits for electric scooter-related injuries after introduction of an urban rental program. The American journal of emergency medicine, 37(8), 1531-1533. DOI: 10.1016/j.ajem.2019.05.003
Cicchino, J. B., Kulie, P. E., & McCarthy, M. L. (2021). Severity of e-scooter rider injuries associated with trip characteristics. Journal of safety research, 76, 256-261. DOI: 10.1016/j.jsr.2020.12.016
English, K. C., Allen, J. R., Rix, K., Zane, D. F., Ziebell, C. M., Brown, C. V., & Brown, L. H. (2020). The characteristics of dockless electric rental scooter-related injuries in a large US city. Traffic injury prevention, 21(7), 476-481. DOI: 10.1080/15389588.2020.1804059
García-Vallejo, D., Schiehlen, W., & García-Agúndez, A. (2019). Dynamics, control and stability of motion of electric scooters. In: Proceedings of the International Symposium on Dynamics of Vehicles on Roads and Tracks – IAVSD, 1199-1209, Springer, Cham. DOI: 10.1007/978-3-030-38077-9_139
Hall, J., Byrnes, E., McMahon, C.,Pontius, D., & Watts, J. (2019). Identifying Best Practices for Managementof Electric Scooters, The Ohio State University. Available online: https://kb.osu.edu/handle/1811/87590
Haworth, N., Schramm, A., & Twisk, D. (2021). Comparing the risky behaviours of shared and private e-scooter and bicycle riders in downtown Brisbane, Australia. Accident Analysis & Prevention, 152, 105981. DOI: 10.1016/j.aap.2021.105981
Kobayashi, L.M., Williams, E., Brown, C.V., Emigh, B.J., Bansal, V., Badiee, J., … & Doucet, J. (2019). Thee-merging e-pidemic of e-scooters. Traumasurgery & acute care open, 4(1), e000337. DOI: 10.1136/tsaco-2019-000337
Ma, Q., Yang, H., Mayhue, A., Sun, Y.,Huang, Z., & Ma, Y. (2021). E-scooter safety: theriding risk analysisbased on mobile sensing data. Accident Analysis & Prevention,151, 105954. DOI: 10.1016/j.aap.2020.105954
Maiti, A., Vinayaga-Sureshkanth, N., Jadliwala, M., Wijewickrama, R., & Griffin, G. P. (2019). Impact of E-Scooters on Pedestrian Safety: A Field Study Using Pedestrian Crowd-Sensing. arXiv preprint arXiv:1908.05846. DOI: https://arxiv.org/abs/1908.05846
Shah, N. R., Aryal, S., Wen, Y., & Cherry, C. R. (2021). Comparison of motor vehicle-involved e-scooter and bicycle crashes using standardized crash typology. Journal of Safety Research. DOI: 10.1016/j.jsr.2021.03.005
Störmann, P., Klug, A., Nau, C., Verboket, R. D., Leiblein, M., Müller, D., … & Lustenberger, T. (2020). Characteristics and injury patterns in electric-scooter related accidents—a prospective two-center report from Germany. Journal of clinical medicine, 9(5), 1569. DOI: 10.3390/jcm9051569
Tuncer, S., Laurier, E., Brown, B., &Licoppe, C. (2020). Notes on the practices andappearances of e-scooter usersin public space. Journal of transport geography, 85,102702. DOI: 10.1016/j.jtrangeo.2020.102702
Yang,H., Ma, Q., Wang, Z.,Cai, Q., Xie, K., & Yang, D. (2020). Safety ofmicro-mobility: analysis of E-Scootercrashes by mining news reports. Accident Analysis & Prevention,143, 105608. DOI: 10.1016/j.aap.2020.105608