To plan for the electrification of public bus lines we developed a toolbox that would work across all sorts of route layout.
Our Toolbox at a Glance
Hypotheses:
– Electric motor efficiency: 0.9
– Battery efficiency: 0.98
– Overall efficiency: 0.88
– Breaking/downhill energy recovery: 20%
– Line service: 300 days per year
Input data:
– Nominal vehicle consumption in kWh/km
– Vehicle mass
– Distance travelled in a round trip
– Distance travelled in a day
– Route elevation difference
– Single vehicle cost
– Electricity cost
– Required frequency and capacity
Exclusions:
– Maintenance costs
– Battery substitution costs
– Personnel costs
– Insurance, damage coverage and civil liability
– Interest rates, inflation and discount rate
Results:
– Battery pack dimension
– Number of buses to be purchased in order to maintain same level of service
– Annual energetic consumption and related costs
– Cost forecast
Methodology
The calculation is based on two main features, route length and elevation, which was possible to obtain using GIS software. Then, data concerning operations (e.g runs per day, frequencies, daily distance travelled) has been provided by the transport operator.
Consumptions due to linear trip and elevation are calculated separately and then summed. For the linear part an average electric bus fuel economy is used, while the energy spent to overcome elevation was calculated as the difference in gravitational potential energy. Because gravitational potential energy is a conservative field and due to the presence of regenerative braking, one might be tempted to assume that all energy spent uphill is recouped in the downhill phase. Unfortunately this is not the case, as there are several losses and inefficiencies. Moreover, regenerative braking only happens if certain criteria regarding vehicle speed, braking intensity and battery state of charge are met. In our calculation the recovered energy is calculated as a fixed quota of the potential energy that could be harvested.
Particular attention is put on containing overall vehicle mass in order to maximise efficiency and passenger capacity. It is important to note that vehicle mass is the parameter exerting the most influence on consumption. For this reason dimensioning batteries appropriately is crucial. The bus shall mount a battery big enough to complete its duty but not so big that it excessively increases weight. A bigger than necessary battery is just dead weight reducing bus capacity. At the same time it would be desirable to give the vehicle a margin of safety for two reasons: one is to give the bus the ability to deal with unexpected events, the other is to avoid getting close to 0% of battery charge. As a general rule, to preserve battery life, it is better to stay away from extremes (both 0% and 100%).
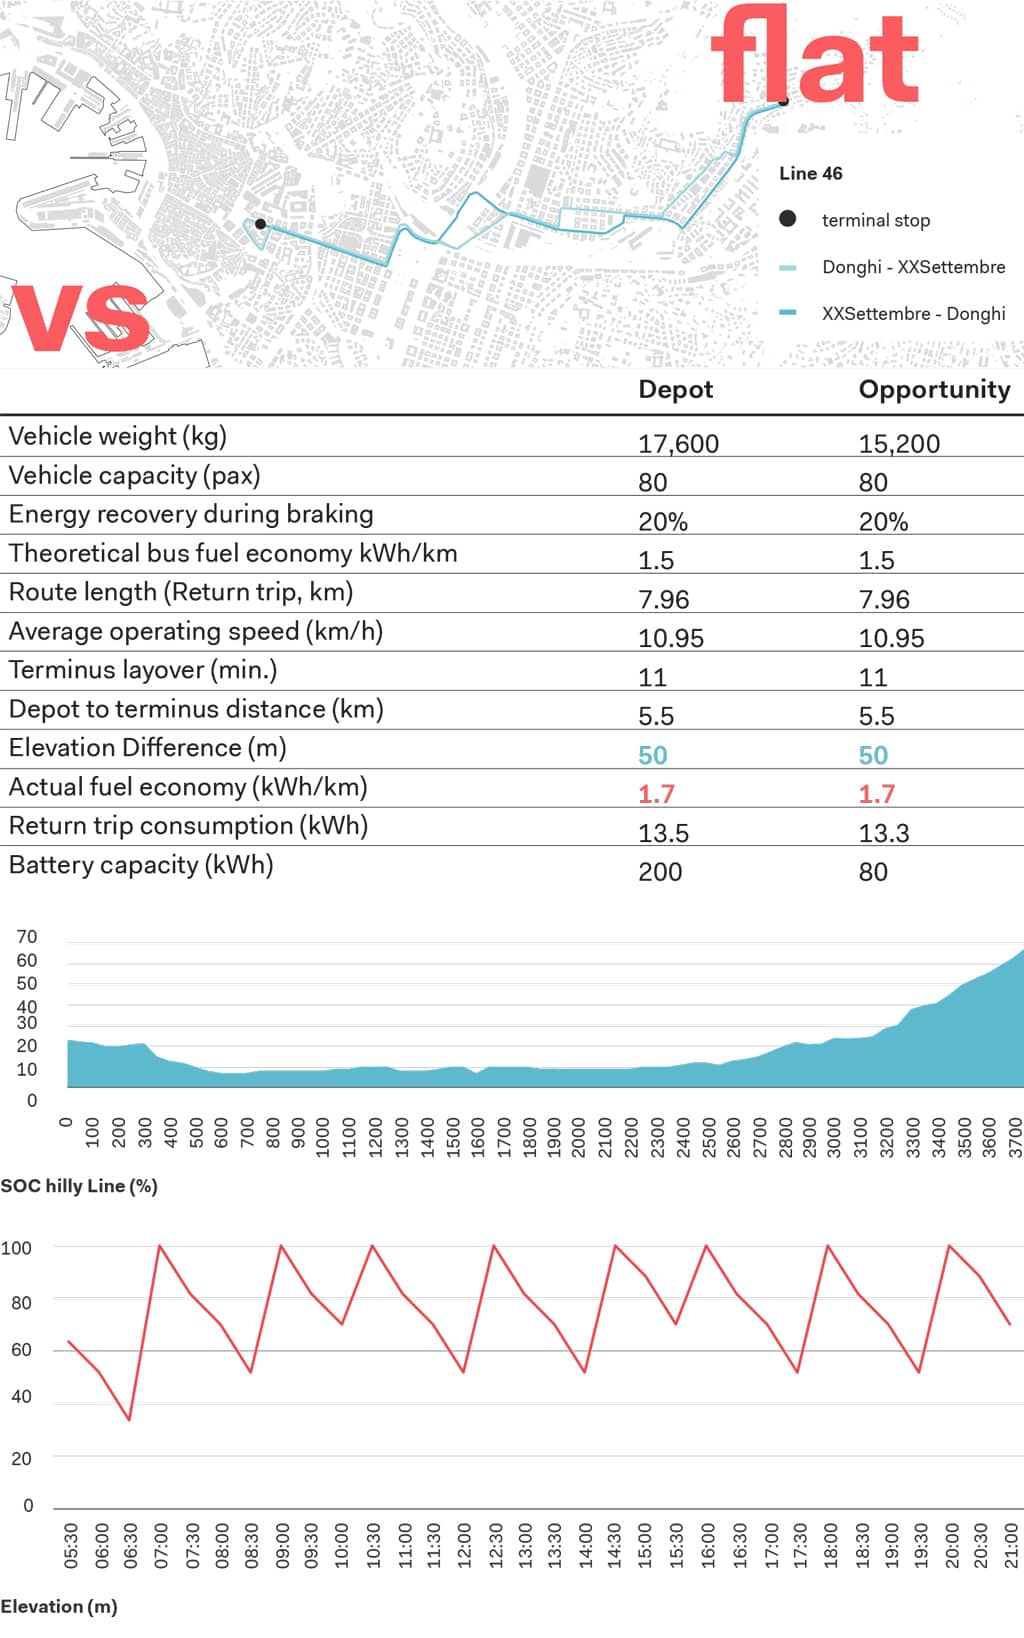
We ran the calculation for both overnight charging at the depot and opportunity charging at the terminus, and the simulation has been carried out in five scenarios representing different passenger loads. To determine fleet dimension, the maximum number of buses circulating during peak time was taken as a starting point. The simulation would tell whether that is enough to operate the line. The results hereby presented refer to the most demanding case with a 100% passenger load. All data and results are summarized in the next page.
The tool also runs a preliminary financial analysis, in which fixed costs are made up of vehicle purchase costs, while the operational costs consist of electricity fees. Different tariffs have been considered for the high-power opportunity charging and the low-power depot charging. The calculation, while lacking the details to make a complete financial case, is sufficient to get a general idea of the order of magnitude of the operation.
Results
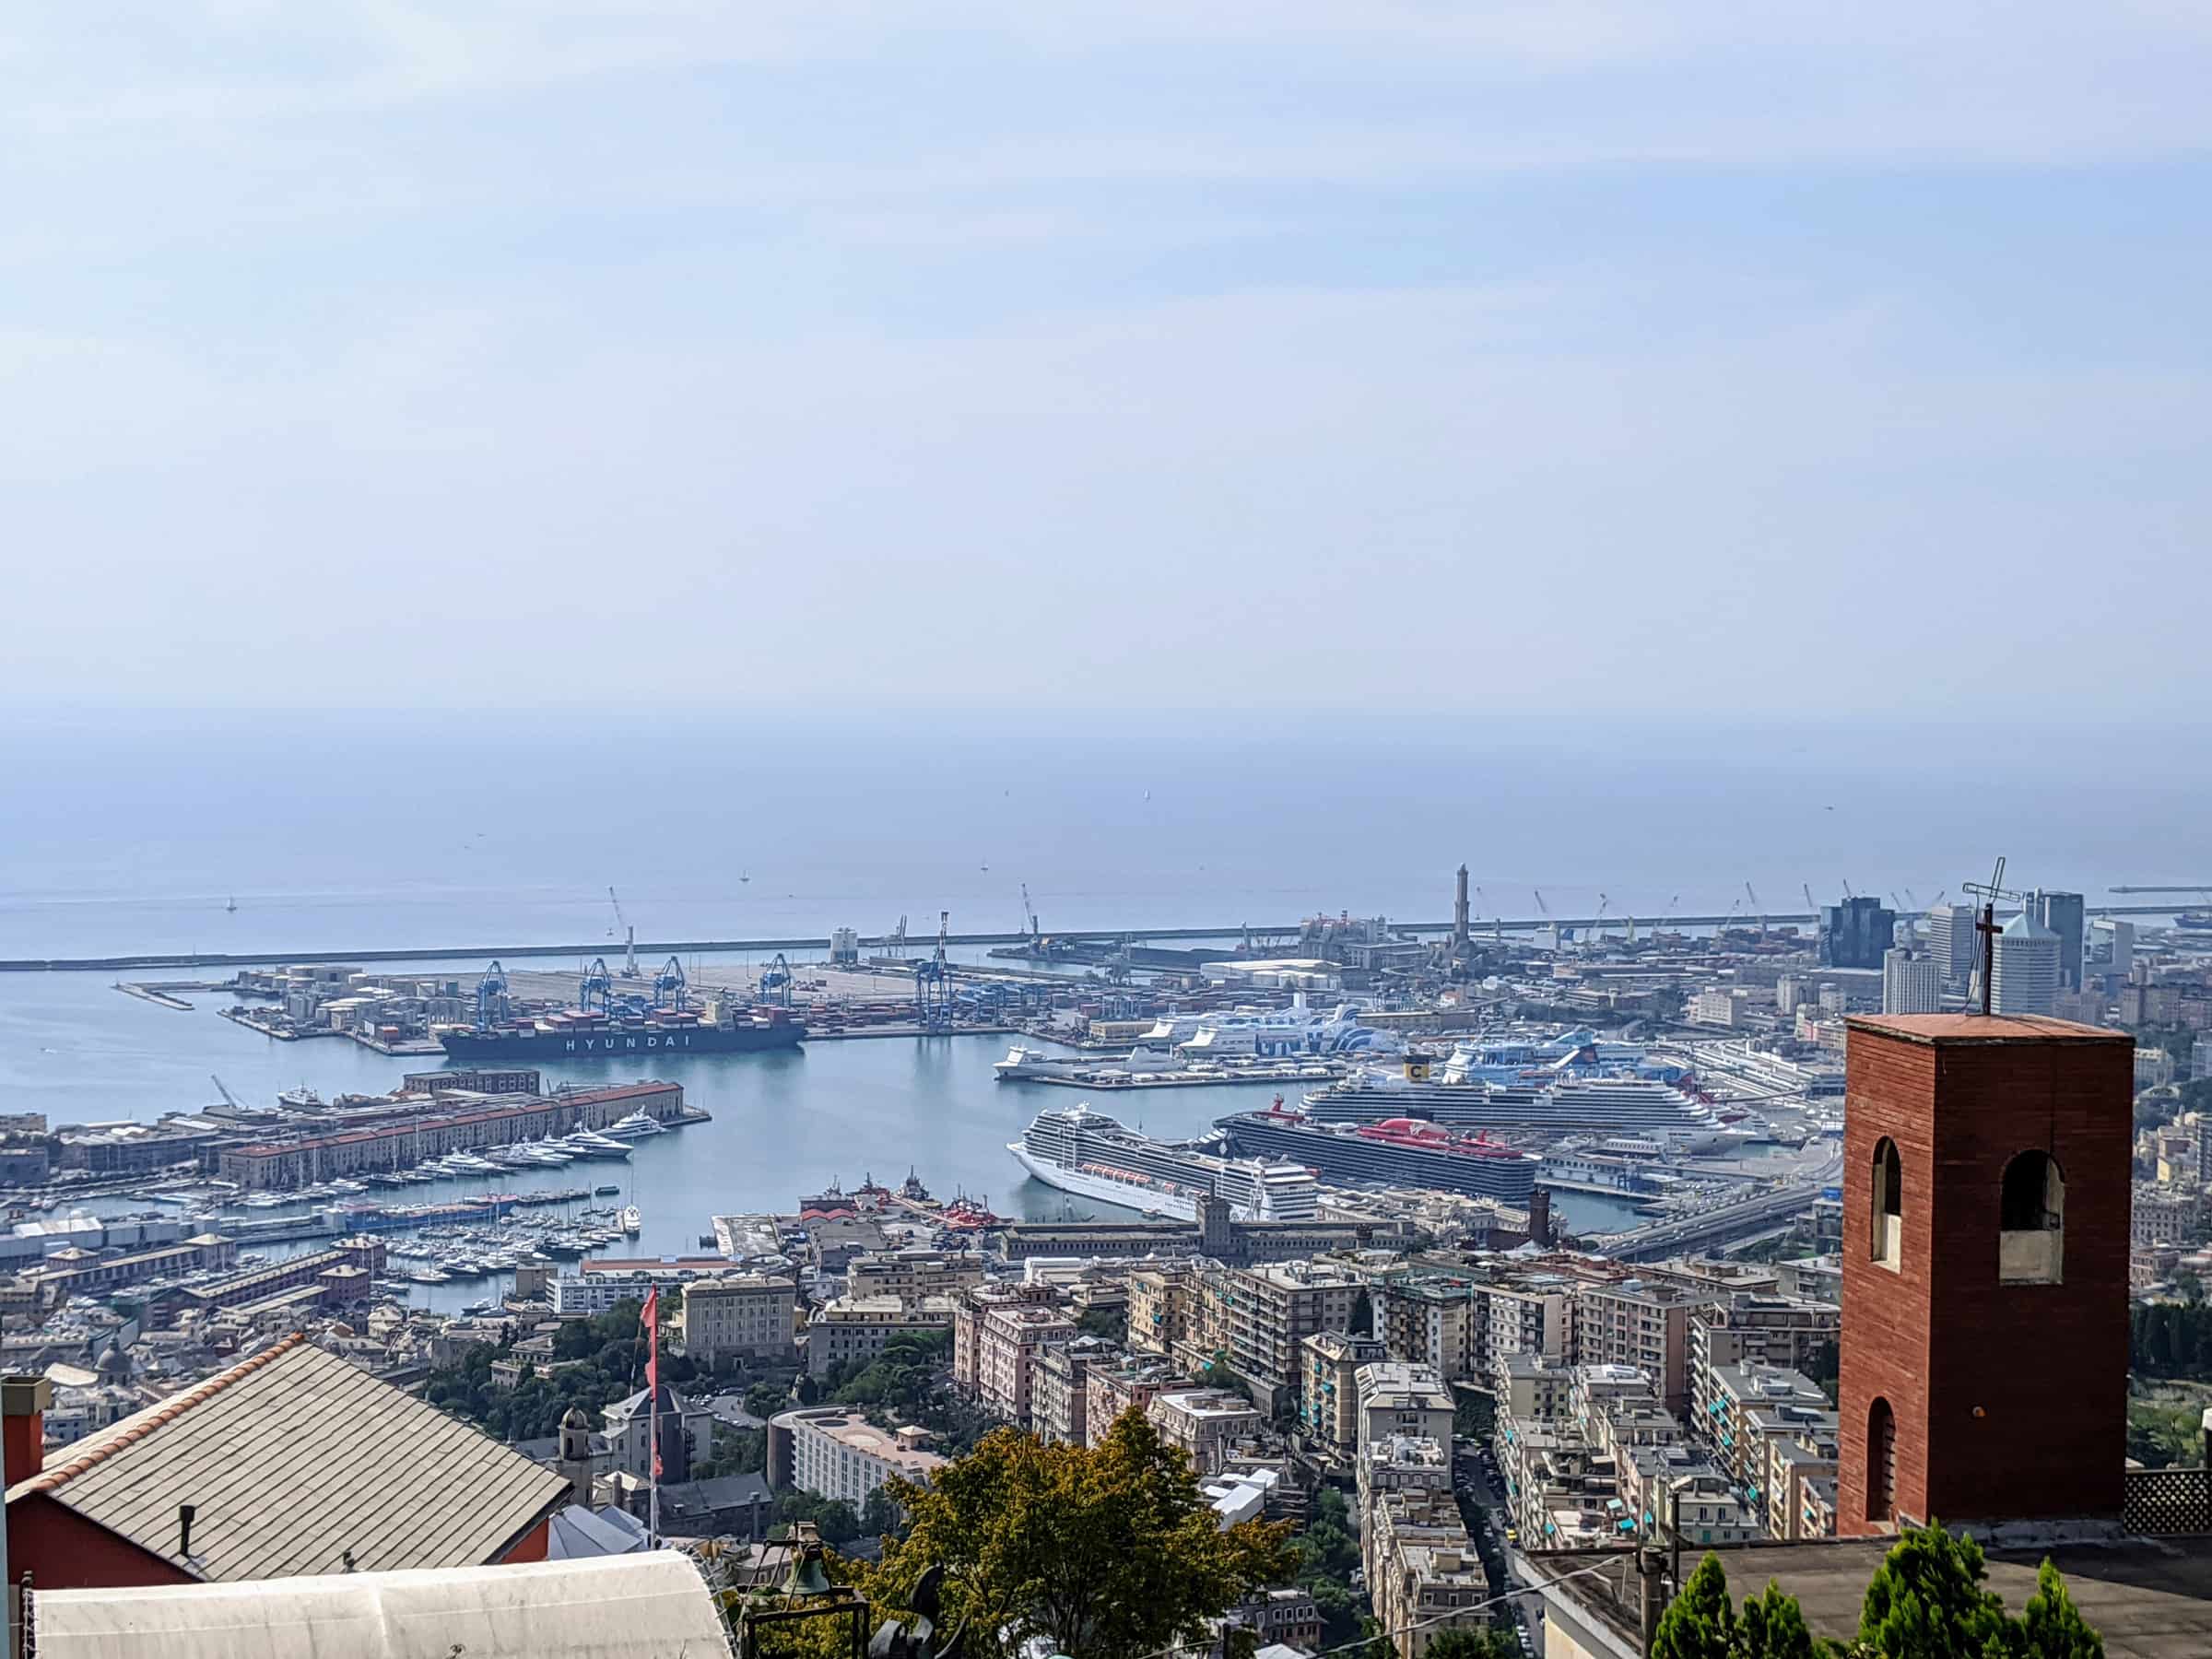
As a case study we applied our tool to two bus lines, one with high elevation and one mostly flat, to highlight how big an impact local topography has on energy consumption. For that purpose we applied our tool to two bus lines running in the city of Genova, where there is a good combination of flat and hilly landscape. According to our calculations it turns out that a hilly layout leads to an increase in consumption up to 58% on a kWh/km base. From the comparison between depot and opportunity it emerged that both lines could be covered with electric buses in depot charging configuration, without the need to purchase extra vehicles.
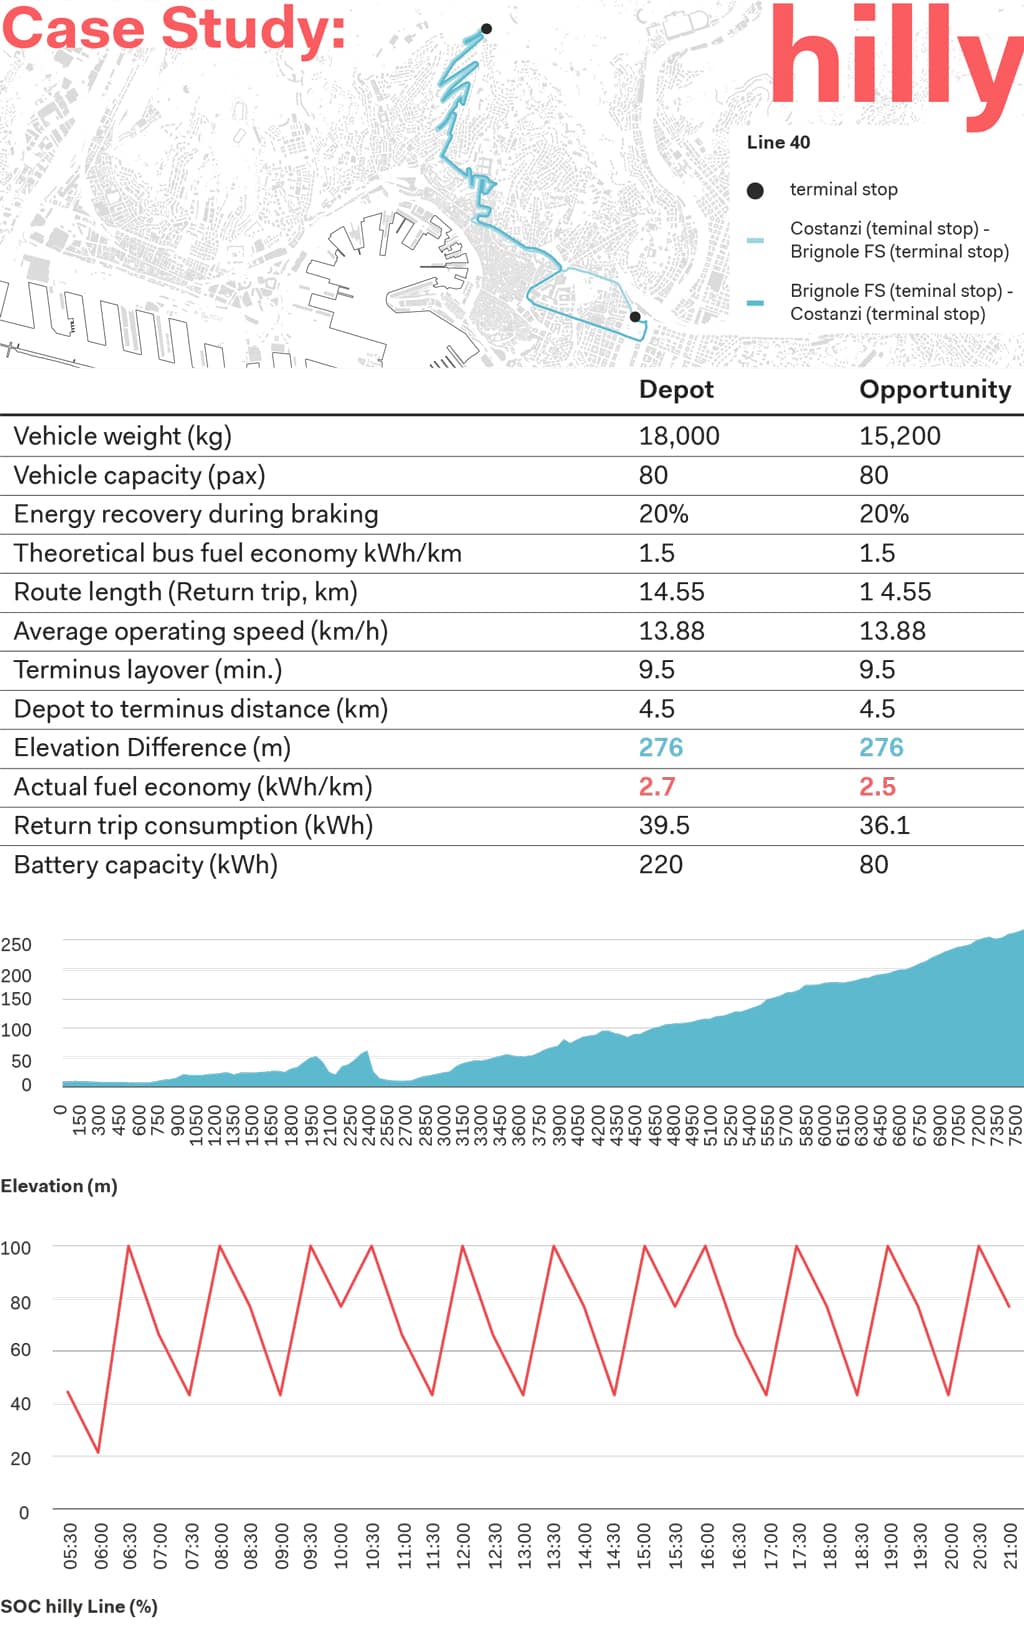
A hilly layout leads to an increase consumption up to 58%.