What cross-cutting trip data from five cities in the U.S. tells us about the overarching tendencies of movement concentrations in different areas within the city and some factors that drives them
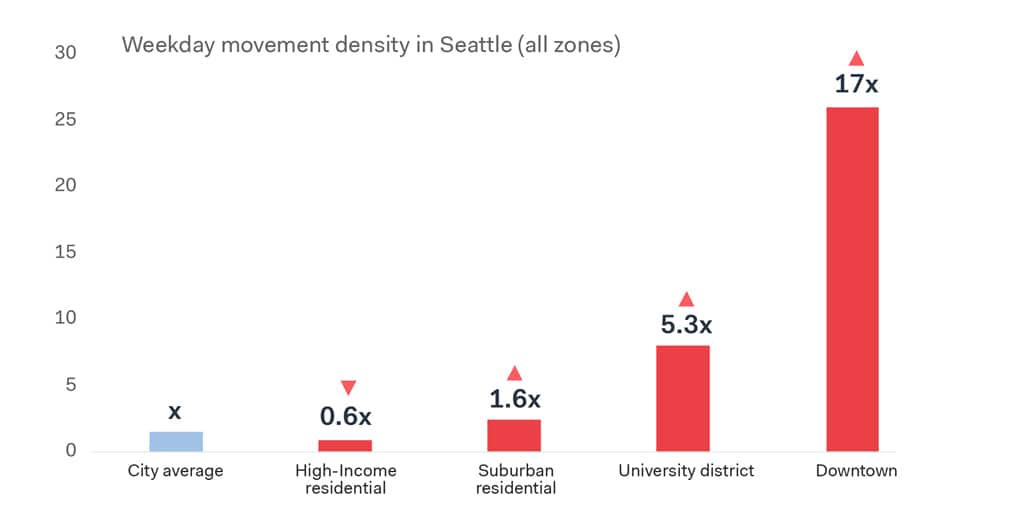
The weekday movement density, i.e. the intensity of trips created on a typical working day in each zone of a city demonstrates intriguing information about the potential movement generation of that area relative to other areas. In essence, we find that downtown areas generate weekday movement that ranges from 6 to 38 multiples of their respective city averages.
Image credits: Ceri Breeze / Shutterstock.com
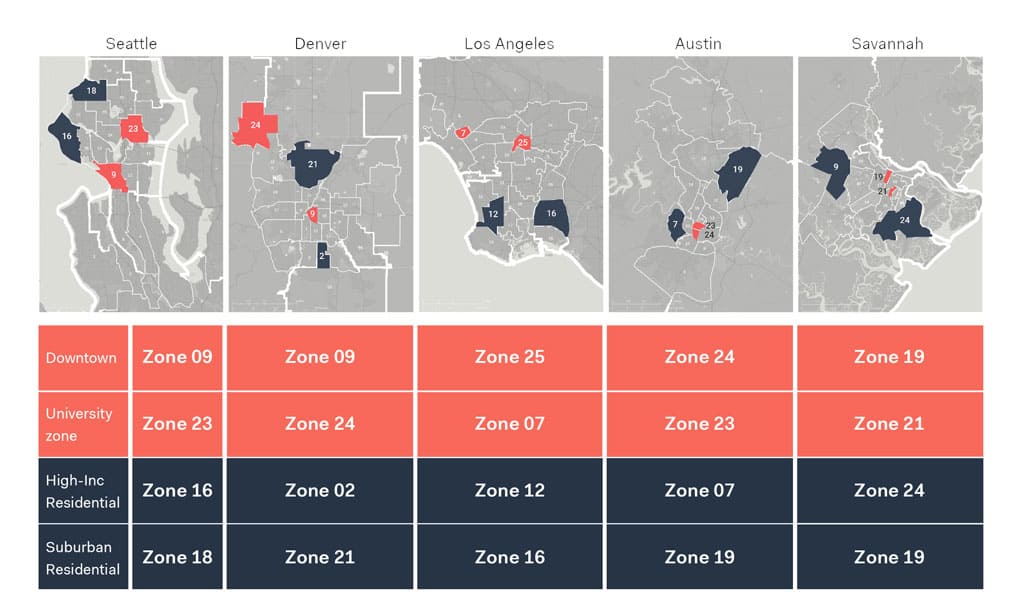
In the following analysis, zone distinctions were based on a number of factors. For each of the five cities under study (namely, Seattle, Denver, Los Angeles, Austin and Savannah), areas associated with distinctive socio-economic profiles and their corresponding travel patterns were identified to create a basis for studying movements in and out of -and between- these articulated zones. The fixed zone typologies identified for each city were two attractor typologies (downtown and university areas) and two generator typologies (high-income and suburban residential areas).
For example, a comparison between the four studied areas of Seattle shows us that, compared to the city average, the high-income residential area generates 40% less trips, whereas the typical residential suburb generates 1.6 times that average (60% higher). At the other end, Downtown has a potential trip generation of 17 times the average, whereas the University district density is only 5 times the average.
A comparative analysis of high-income residential areas and downtown areas in each of the cities shows an anti-correlation between the densities of the two. A relatively high density of downtown movements in one city is linked to a relatively low density of movements in its high residential district, and vice versa.
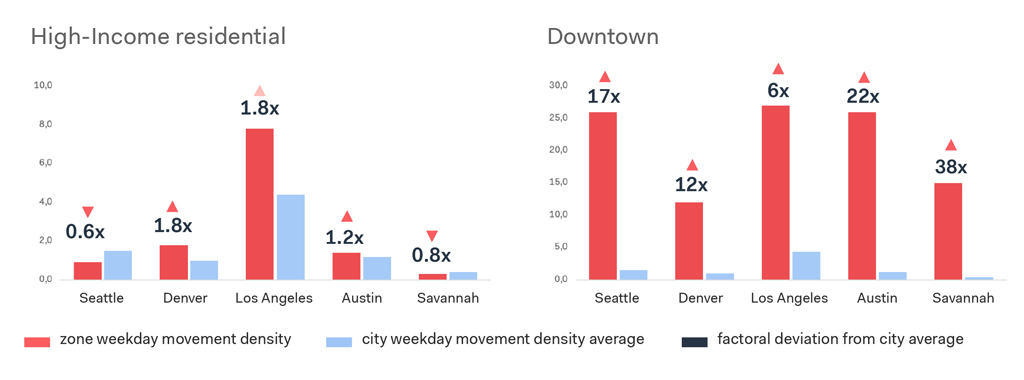
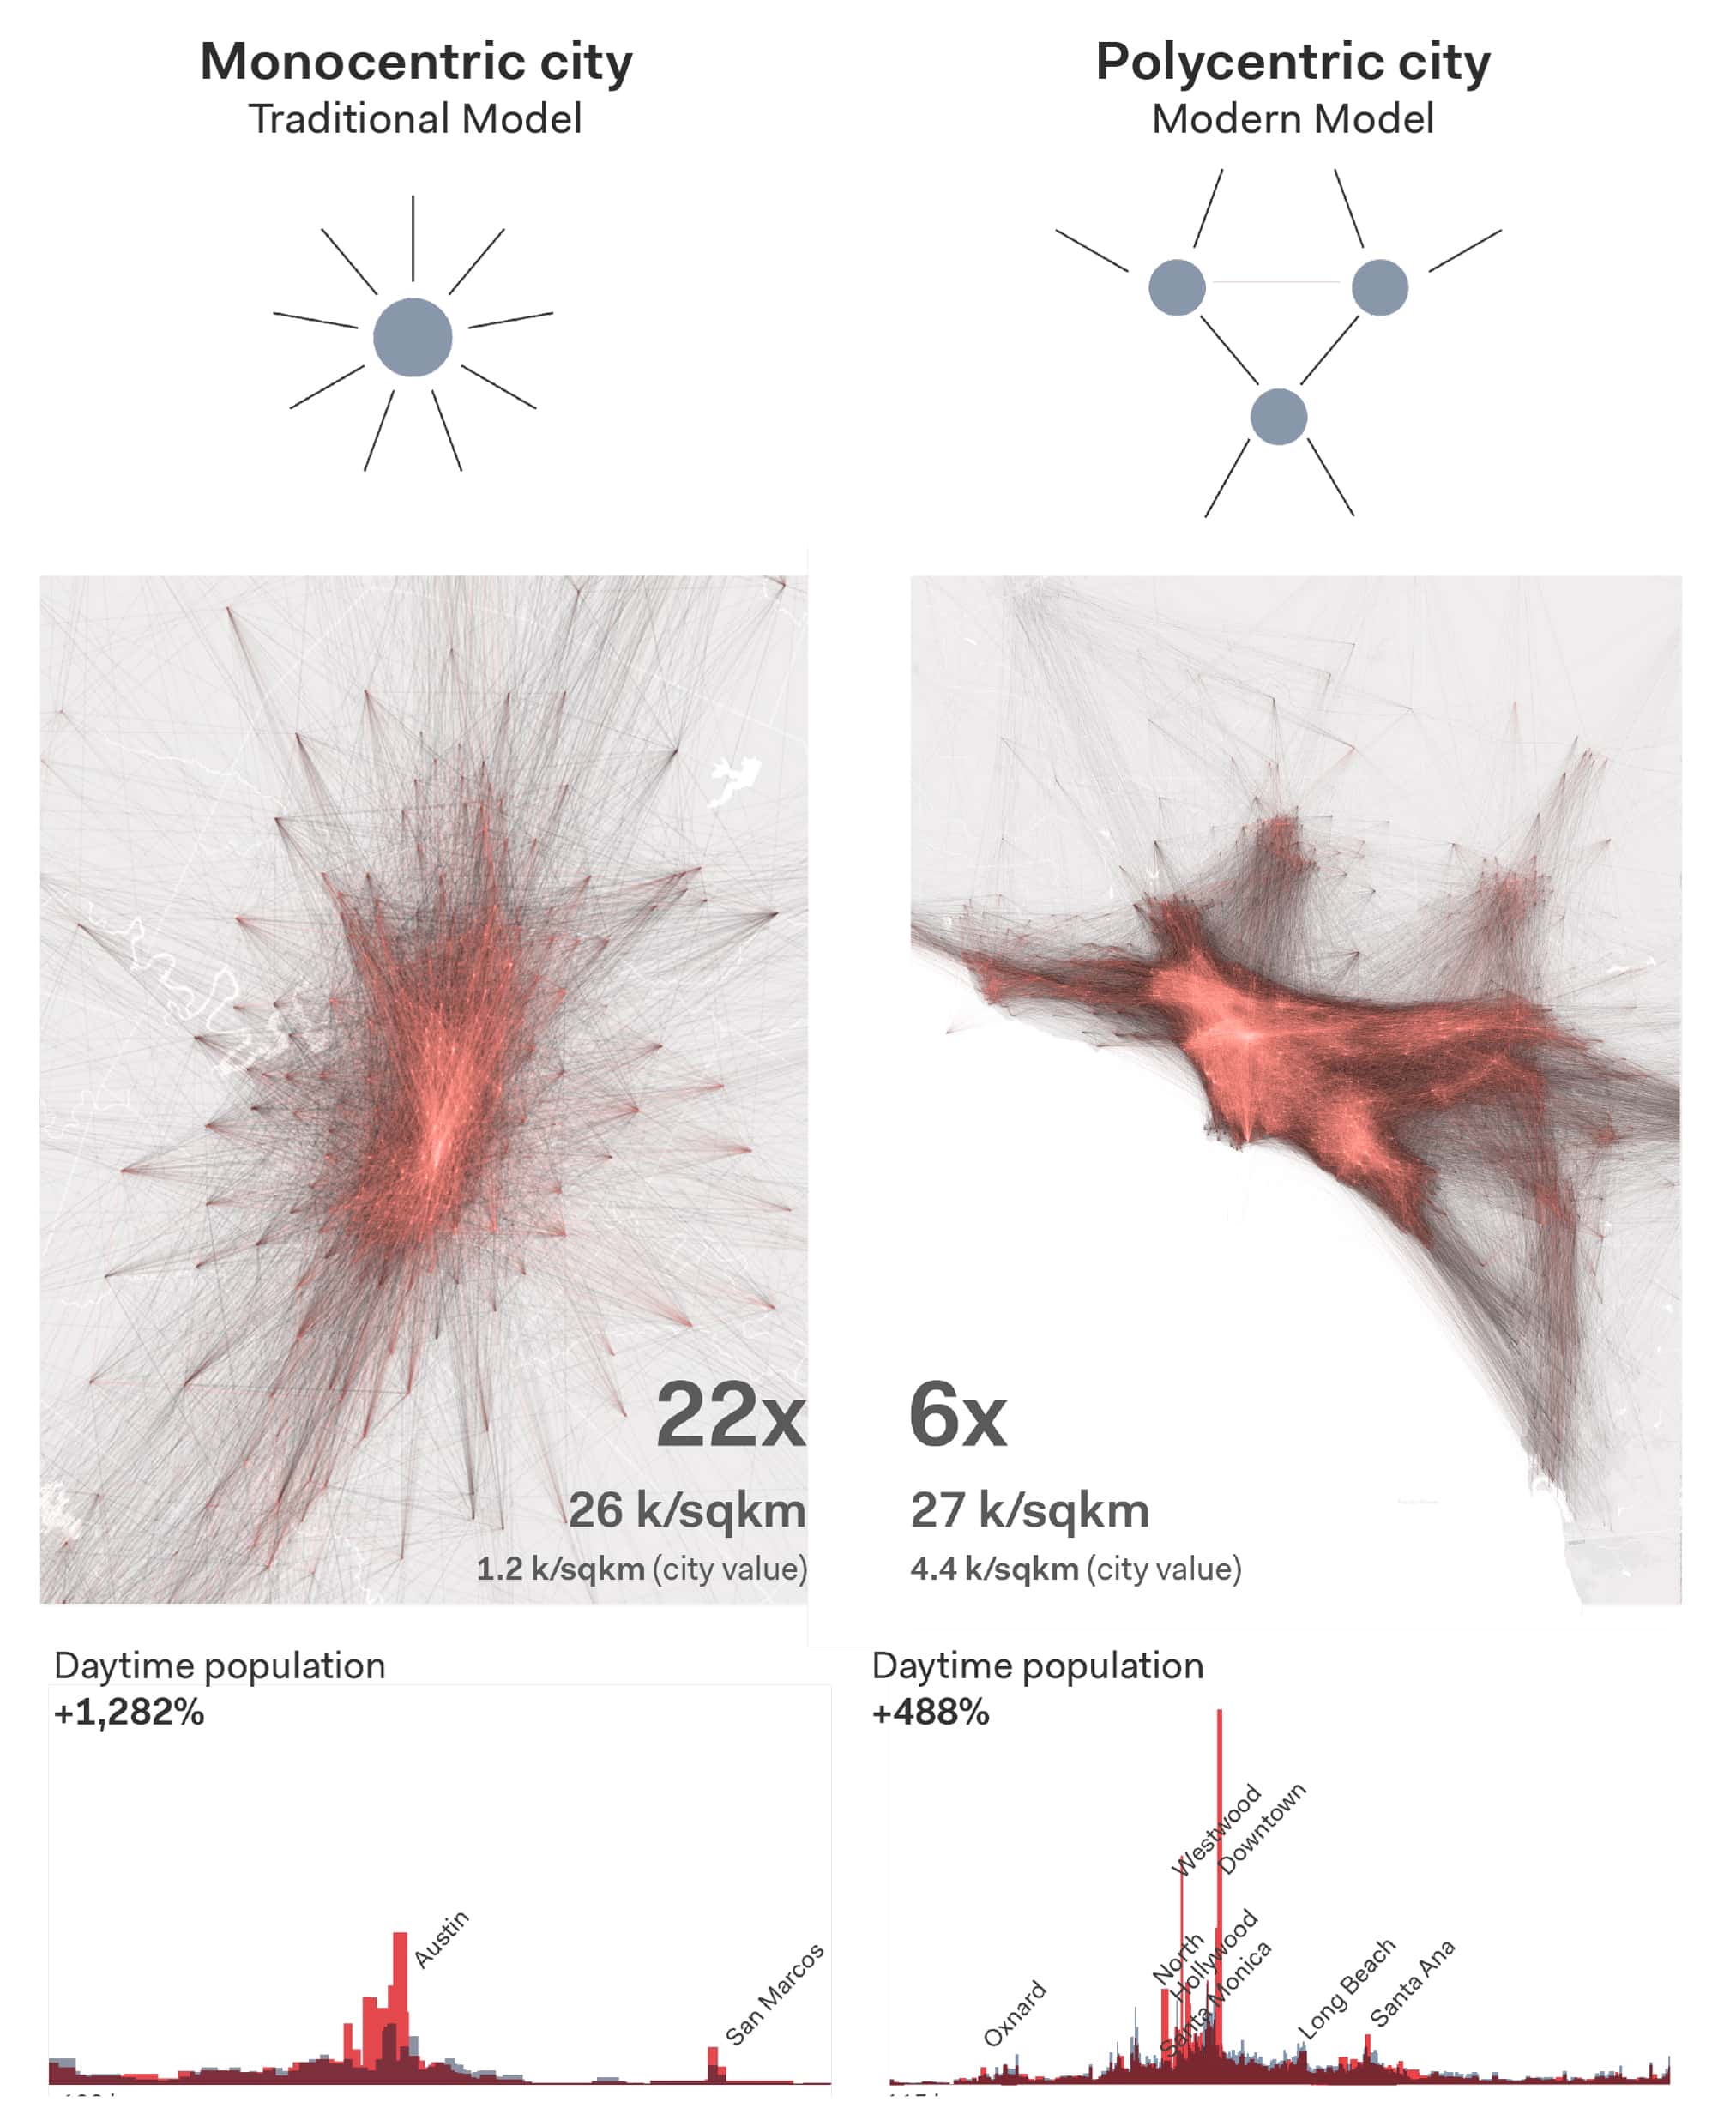
Among downtown areas, we find that there are major density differences between the studied cities. On the one hand, Los Angeles and Denver’s downtown densities increase by factors of 6 and 12 compared to the city average, while on the other hand, Austin and Savannah’s downtown densities reach 22 and 38 times the city averages, respectively in these zones. Balanced and imbalanced distributions of density point to fundamental morphological differences between the cities’ urban structures: whereas the downtown area in the second group of cities tends to be overpoweringly the dominant center for jobs and services, the first group of cities have polycentric structures, meaning that jobs and services are more evenly distributed among several areas, besides downtown. This pattern becomes clear when we visualize movement density over a linear spatial representation of the cities of Austin and Los Angeles as examples. In the Austin Daytime Population visual, it is clear that the movement intensifies in a single central area, whereas in the case of Los Angeles, the increase is more widespread across several of the city’s areas.
Monocentric and polycentric cities differ in how movement density is distributed across space and time. Monocentric cities tend to be associated with higher travel costs, greater travel distances and higher congestion levels. Austin and Los Angeles are two striking prototypes for the diversity between these two models.