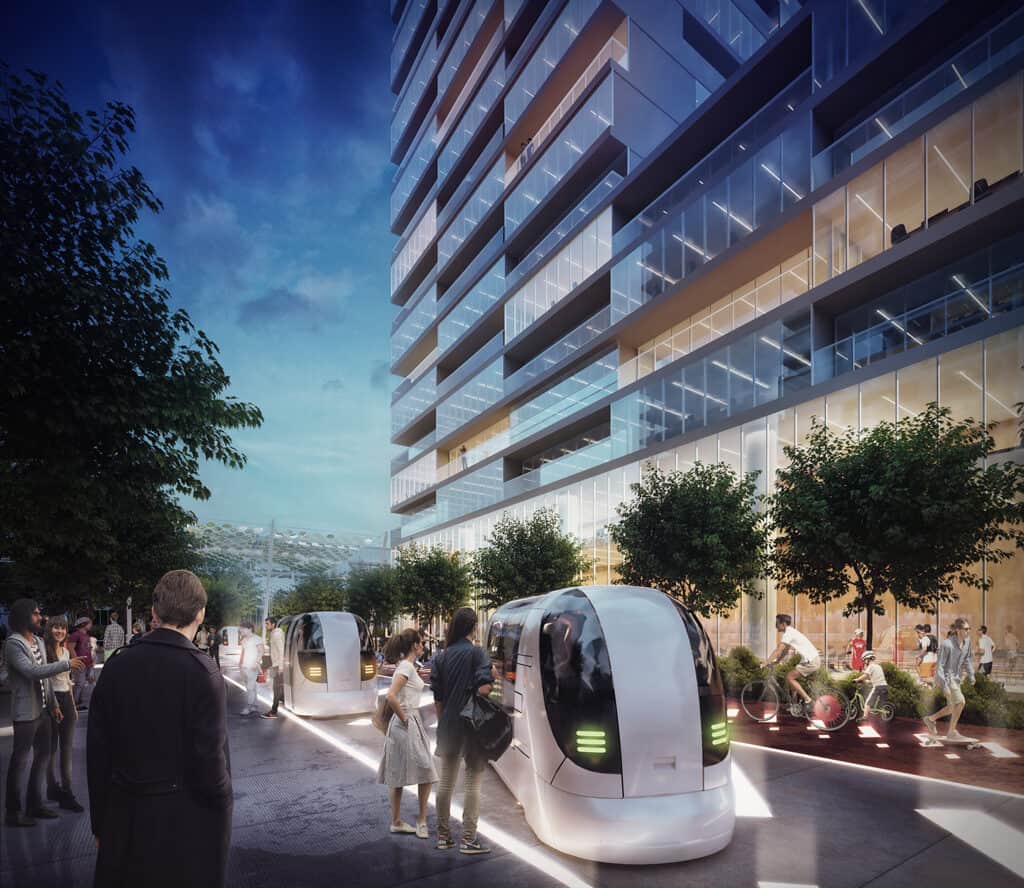
… where shared and autonomous mobility reduces the need for private vehicles
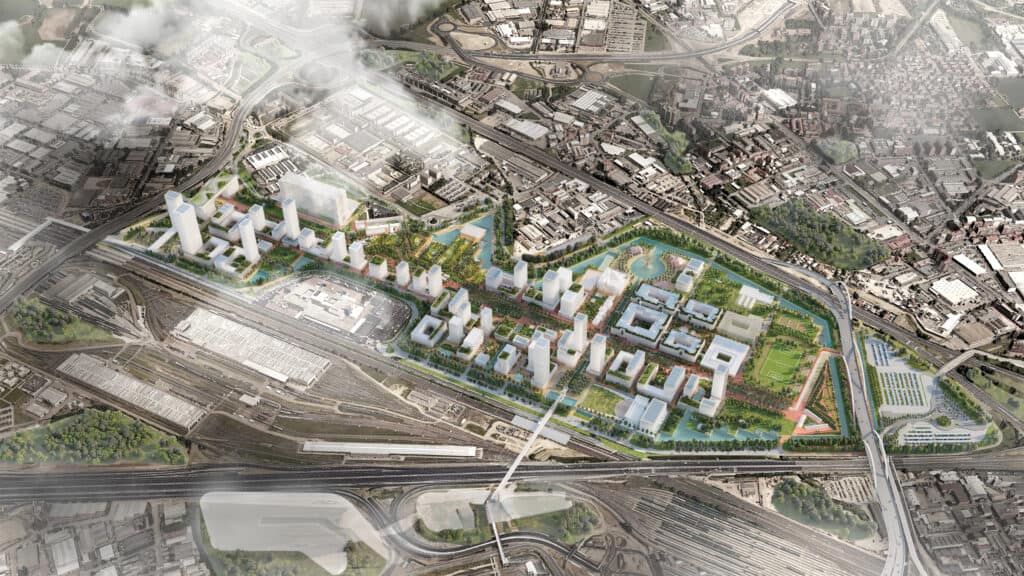
Milano Innovation District (MIND) is one of the most important European urban regeneration projects, a new urban polarity of Milan of around 1 million sqm of total GFA – at full development capacity – and 460,000 sqm of public parks, mainly focused on science, research and technology and is envisaged to become one of the most disruptive international hubs of innovation. From the urban perspective, one of the main aspirations of MIND is to explore and test future models of living as well as future paradigms of moving, being mobility in fact the dimension that better explains the functioning mechanism of our cities and the internal relations underneath. With this respect, MIND is planned to act as an international testbed of the most disruptive and pioneering technologies and solutions on mobility. To this end, a key challenge to tackle is to convert a visitor-oriented site, that is a site designed for Expo 2015, to a community-based district, made by a large variety of permanent uses.
The MIND mobility plan gravitates around the principles of walkable user-centric development and it is shaped by an effective Mobility as a Service (MaaS) model, including the provision of demand-responsive systems, intelligent cognitive infrastructures and future proofing-adaptive transport assets.
With this respect, electric mobility represents the central dimension of the overall mobility concept of MIND, especially as far as all internal transport services are concerned: in fact, all internal public transport services, on-demand services, micro-mobility solutions and lastmile logistics systems are designed to be operated by e-mobility solutions. Moreover, the zero-emission mobility model is further promoted for the multi-modal accessibility at larger scale through a well-dimensioned recharging equipment at both private and public car parking as well as specific facilities for external e-bus services, reinforcing the gradual shift of traditional public transport services to electric solutions.
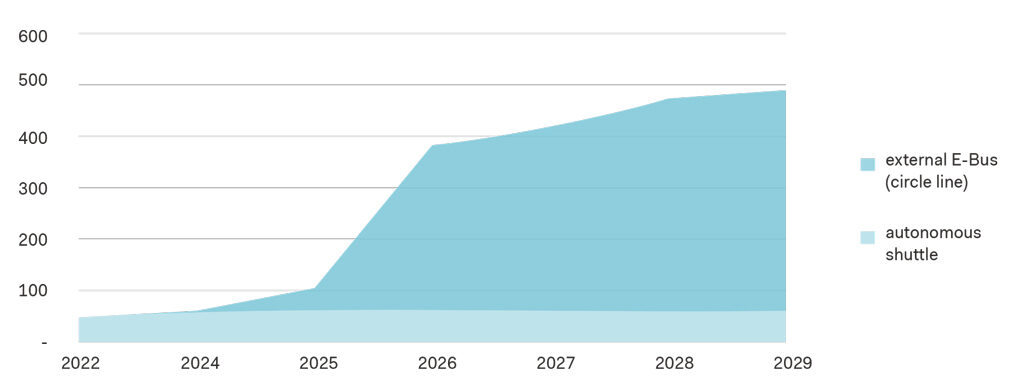
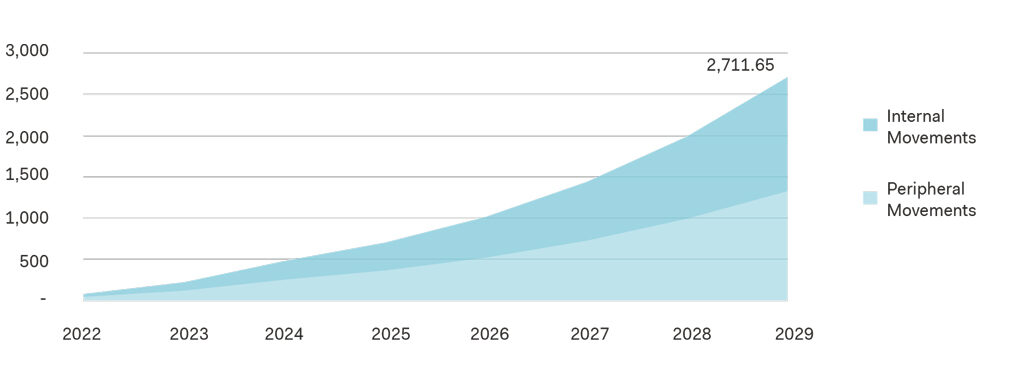
As a leading example of a sustainable ecosystem, a thorough evaluation of the environmental impact is at the core of the context of MIND. An accurate estimate of the number of vehicles in circulation and the average distance they travel is generated on the basis of a full-fledged transport modelling exercise. In fact, the environmental assessment is based on the difference in emission factors for every unit of distance travelled. Internal and peripheral circulation have been analysed separately, as well as private and public transport. More specifically, the evolution of public transport is divided into two parts: first an autonomous shuttle is introduced, increasing fleet and/or frequency every year up to 2024.
From then on, the fleet still increases over time, but the overall annual vehicle-kilometres are almost unchanged. For this reason, emission levels associated to this mean of transport remain flat in the following years due to capacity constraints. The second operational phase begins from that time horizon with the introduction of an additional circular public transport line running on a loop system around MIND, increasing the level of service through the years as local mobility demand grows.
Concerning vehicle type, a full electric fleet has been considered for both the internal autonomous service and the external bus line. For the circular line, traffic data is discerned into peak and off-peak, and the two contributions are summed.
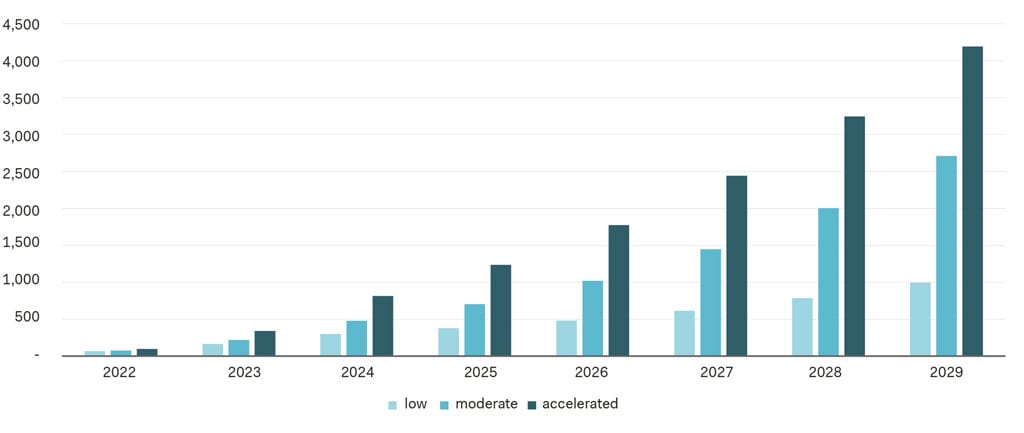
When it comes to private transport a much wider vehicle population sample is taken into consideration, and making assumptions becomes a crucial step. Thus, many studies have been published in recent years, as the subject is under constant scrutiny. Projection data about EV share evolution are based on findings from the E-Mobility Report 2018 published by Politecnico di Milano Energy & Strategy Group. Because this is such a hard topic to predict, a division into low, moderate and accelerated scenarios is maintained in order to gain a wider perspective. The resulting EV adoption rates for the next ten years have been applied to the transport model.
As a result of traffic simulations, the amount of CO2 that can be spared from the atmosphere thanks to the electrification of transport is estimated and reported in the charts. The data is divided into internal and external movements to highlight the contribution of each.