
Proximity, density and diversity: Local centers to support living at neighborhood-scale
The Covid-19 pandemic has dramatically influenced the way we live and move. Movement within the city has been dramatically reduced in both the number of trips and duration of movement with preference for the private automobile, rather than public transport. As a result, the neighbourhood scale has returned to being extremely important; ensuring density, proximity and diversity of services in a widespread manner within the city is beneficial in order to reduce the pressure on local public transport, while at the same time, granting accessibility to all those necessary functions that we need in our daily lives. This is a key topic and was being addressed prior to the pandemic as a concept known as the ‘15-minute City’.
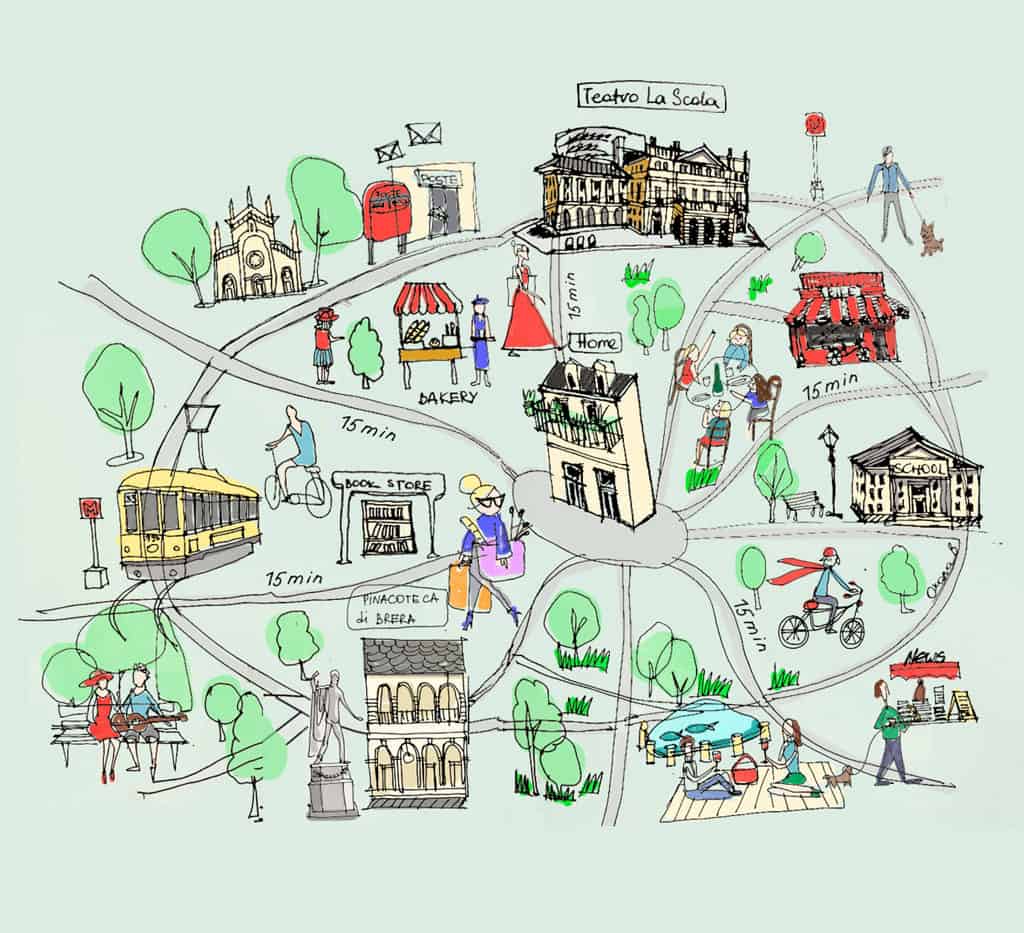
The ‘15-minute City’ is a term given to the vision adopted by the Mayor of Paris, Anne Hidalgo, whereby every resident is envisioned to be able to reach a number of essential services on foot or by bicycle within 15 minutes from their home. This concept rests on the idea of localized living, whereby residents could satisfy the bulk of their daily needs without the need for long motorized journeys. Across the globe, numerous cities have adopted similar models, ‘20-minute neighbourhood’ plans were already underway in Portland and Detroit in the United States, Ottawa in Canada and Melbourne, Australia. More and more cities are joining the movement. For example, the newly developed “Milan 2020 Adaptation Strategy” plan promoted by the Municipality of Milan for ‘Phase 2’ of post-lockdown containment makes reference to the same principles of the “15-minute City”: promoting the neighborhood scale guaranteeing services proximity, density and diversity.
This study draws its inspiration from the above-mentioned concepts of the 15-minute City and serves as an analysis framework with the aim of identifying “local micro-centers” within Milan. As micro-centers we define those pedestrian-friendly areas of the city where the compresence, proximity and service diversity are guaranteed. The article proposes a replicable methodology to evaluate the state of the art and therefore the potential of a city in providing adequately ‘local centers’ with dense availability of services to its residents.
The role of the municipality
The “15 minutes city” concept is highly ambitious because the idea of favoring functional mix areas goes against years of urban planning ideologies where the goal was to do the opposite, separating residential areas from areas of work and leisure. Local diversification and neighborhood scale living, which was made necessary by the continuous expansion of cities, will improve citizens’ quality of life by reducing travel times and reliance on heavy modes of transport.
For this concept to materialize, city administrations must assume a proactive role in defining the array of ‘essential services’ to define local micro-centers. In Paris, an initial categorization of these services was conceived based on daily citizens need groups, such as: work, food, health and so on. These macro-categories must be detailed by municipalities, professionals, researchers, and citizens into more concrete lists of services.
Once a list of services is defined, municipalities can identify the neediest neighborhoods as those in which density and therefore accessibility to local centers is weakest. This step will then inform strategic intervention and organize priority-based action plans for city neighborhoods.
Neighborhood essential services
In the absence of a comprehensive list of services to follow, the work was inspired by the documents disclosed by the city of Paris regarding the concept of “15 minutes City”. The same macro-categories (food, health, open spaces, sports, education, work, culture/leisure and mobility) were considered.
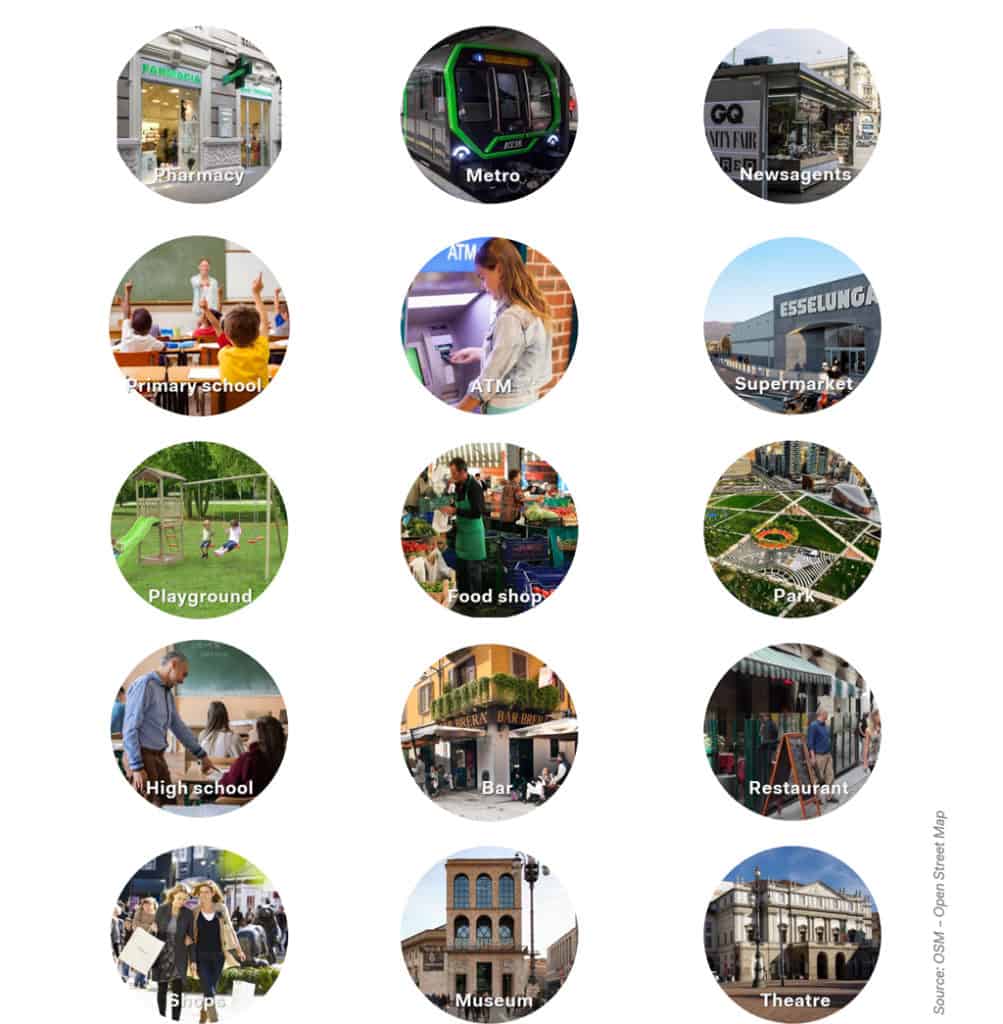
The goal is to identify Milan local micro-centers which are characterized by diversity, compresence and proximity of the aforementioned services. For this purpose, the analysis was set up considering the service with a fewer presences (pharmacies) to which a 15-minute walk buffer was applied to guarantee the maximum proximity. The requirement to guarantee the diversity was to verify, within the predefined pedestrian area, the presence of at least one service for each category considered. Starting from these identified local centers, the city was then mapped using the Voronoi tessellation method.
The Voronoi diagram is an aerial partitioning of space into “regions” based on the distance of the points from which they are generated with respect to all points of the plane. For each point of origin (in our case, for each local center identified) there is a corresponding “region” consisting of all points of services closest to that particular point. For each polygon, the maximum distance to travel was then calculated to differentiate between different accessibility levels.
De-constructing the city identifying its local centers
A mapping of the city using the Voronoi method described in the previous section can allow us to read the city as a tapestry of urban local centers of various access levels. All polygons indicated in pink have a dimension that allows reach to all service categories in less than 15 minutes on foot; those in orange in 15 minutes by bike; and light blue areas are those in which the identified local centers cannot be reached by either mode in the given timeframe.
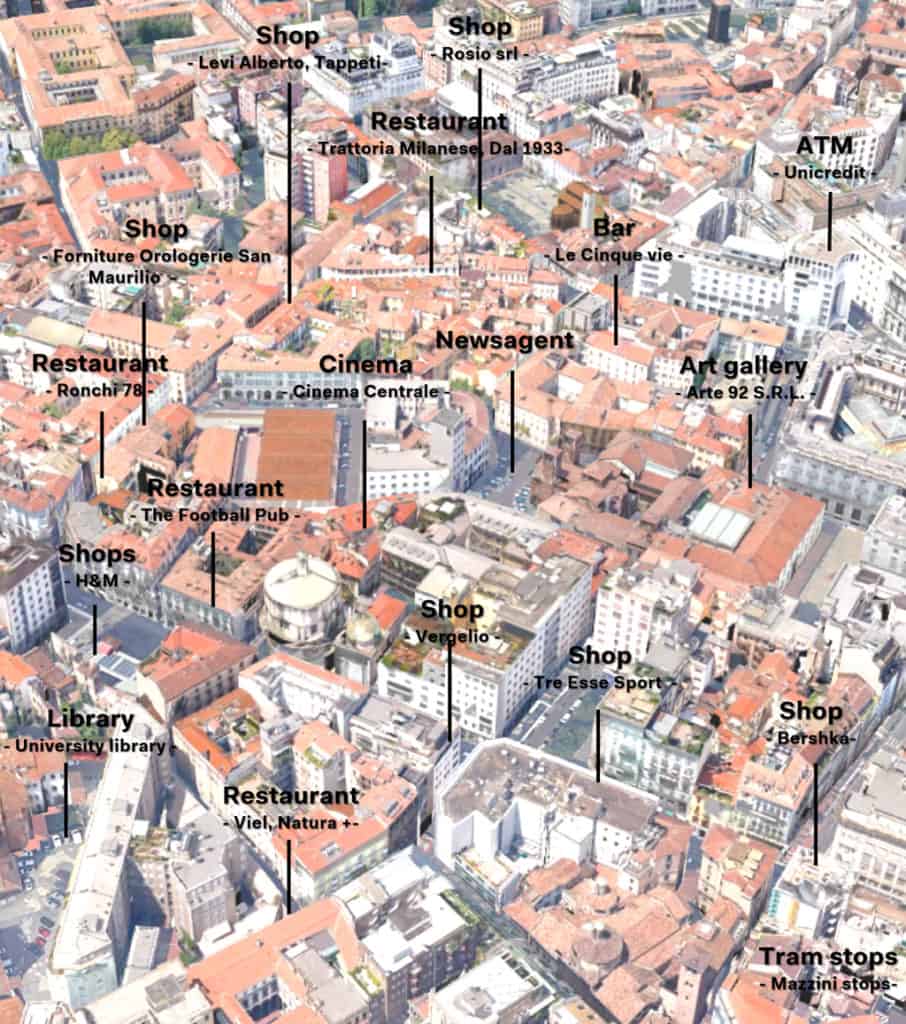
A quick reading of the mapping result shows a clear transitory pattern from inner city districts, where local centers are denser and therefore more accessible by foot, to peripheral areas, where there are few centralities and it takes longer than 15 minutes to reach these areas. A number of central districts stand out for achieving diversity, proximity and density in services: these include Porta Garibaldi-Porta Nuova, Porta Venezia and Brera. These neighborhoods offer a model for local living that should be studied to gain insights into plausible approaches to be adopted at city scale.

Local centers and population distribution
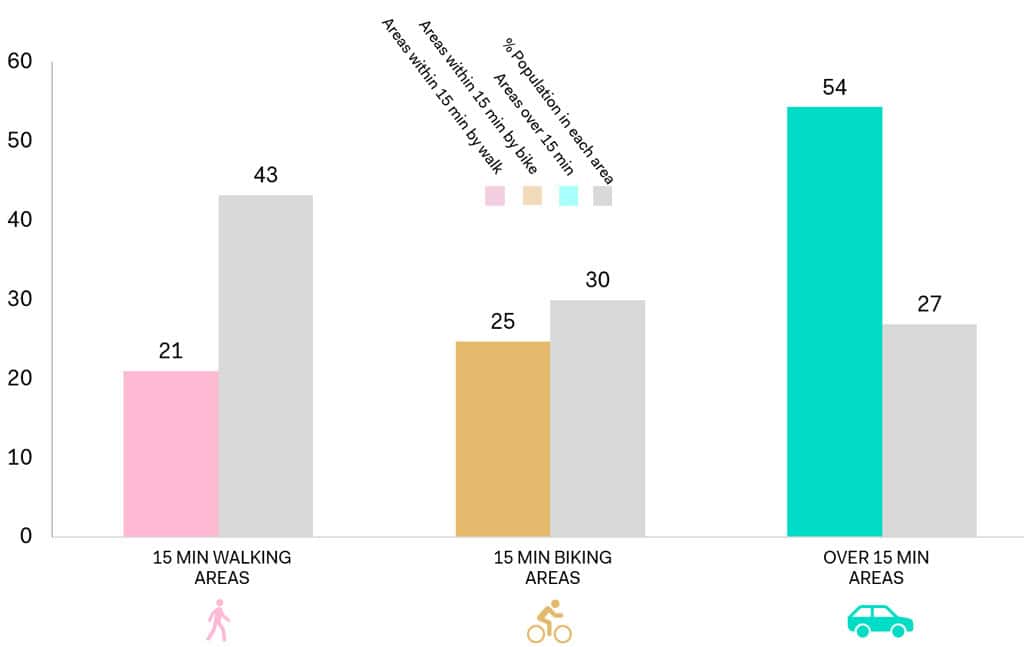
As shown in the previous mapping exercise, more than half of the surface area of the city is characterized by low-proximity and low-density local centers (54% – light blue areas). However, looking at these areas in terms of the distribution of residents provides a more detailed insight: in these low-proximity areas in which residents are required to travel more than 15 minutes to reach the identified areas with high compresence of services, only 27% of the population reside. In fact, the largest segment of the population (43%) lives in areas with high density and proximity of micro-centers accessible by foot (pink areas). This data partly conveys the reality of high proximity being a function of high residential densities. It is not surprising that people have to travel shorter distances in high-density areas to reach the services they need. Careful consideration of the types of services available in underserved areas (light blue) is thus essential to understanding and compensating accessibility shortfalls.
Local centers composition
In the following diagram, we analyse in more detail the typical distribution of services in the three broad accessibility categories of urban micro-centers.
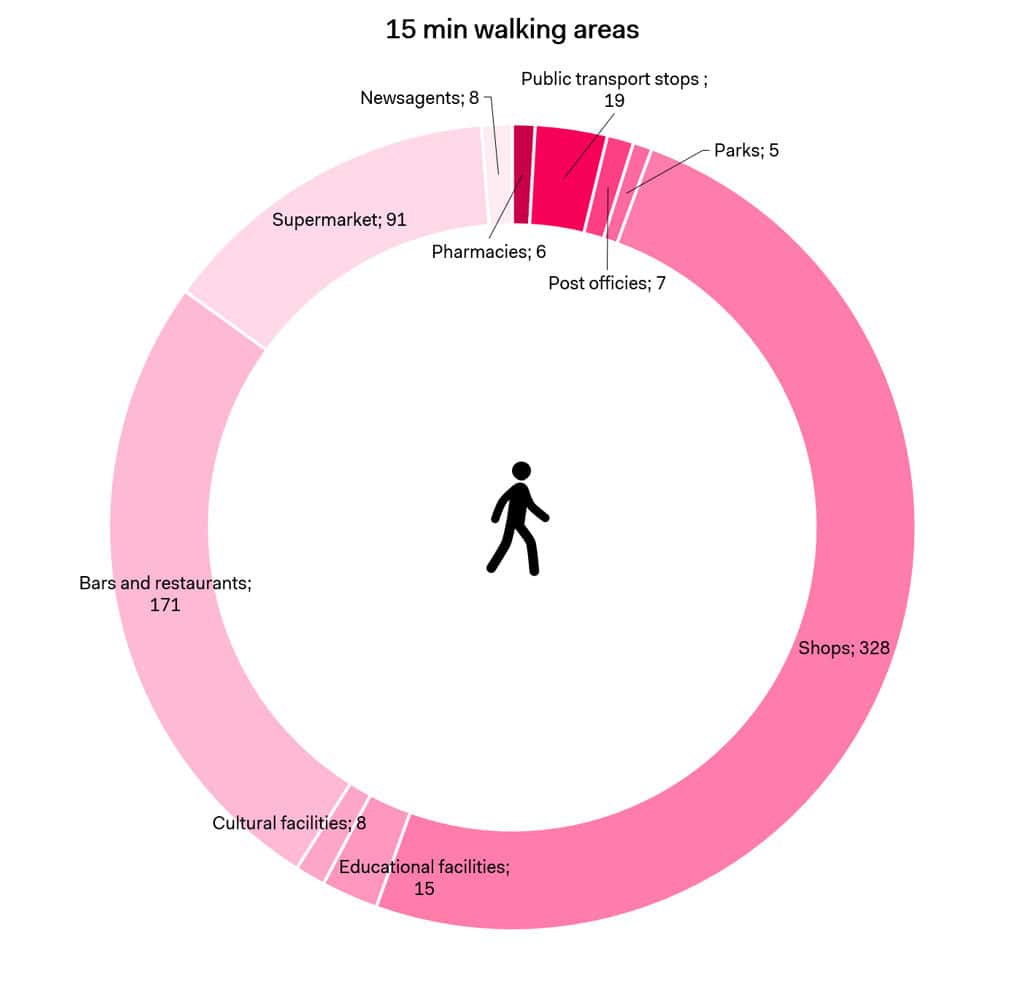
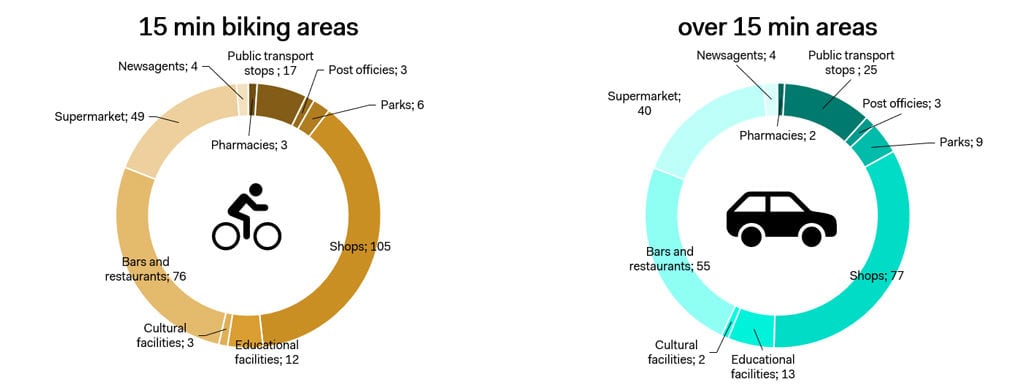
By zooming in on zones with high accessibility within 15 minutes by foot, we compare how services are subdivided in comparison with less dense and less accessible micro-centers. The first thing that becomes clear is that these areas, one that are the most central, are usually rich in shops. In fact, nearly 50% of the essential services available in areas with high foot accessibility fall under this category, in comparison with about 38% in 15-minute cycling zones, and 33% in less accessible areas. The second largest category of services is ‘eating’. The distribution of this category remains unchanged in the 3 area types: food outlets and bars and restaurants collectively make up 40-45% of the service offering in all the areas analysed. All other services remain more or less consistent, except for large parks whose presence is greater in the more peripheral areas.
If we look in more detail at data collected we discover, an average pedestrian friendly micro-center (15 min walking area) in Milan is mainly composed of 330 shops (50% of the total), 170 bars/restaurants and 90 supermarkets (representing 40% of total services). This very interesting result should be used as basis for further reprogramming of service distribution, with the ultimate goal of increasing service availability to all residents.
Essential services such as groceries represent 40-45% of services within the identified areas. Liesure services, such as cultural and shops, instead decrease in less accessible and more pheripheral areas.
Intervention strategies
For each category of urban micro-centers a set of strategic actions would be proposed to help bring each area type to its highest accessibility potential. Most of the areas in need, i.e. those which are not accessible either by foot or bicycle within 15 minutes require the most intensive intervention in the form of diversification and densification of services. Furthermore, in areas with sufficient foot accessibility, it suffices to improve pedestrian and cycling infrastructure to ensure easy and comfortable access to already existing services. For the middle category, a mix of both interventions can be optimized for each zone.
Efficient strategies to increase service offering in underserved areas can be derived from multiple initiatives. For concerns of accessibility for example, the concept of the super-blocks in Barcelona has the aim of encouraging pedestrianism and social relations. In Paris, on the other hand, the expansion of road space for the circulation of bicycles and pedestrians helps promote the reliance on these more sustainable travel modes. For concerns on service, density and diversity, for example, there are some initiatives to reuse abandoned spaces or temporarily unused spaces (such as school yards during evening hours) for the provision of services and activities for the community that are otherwise deficient. To increase the supply of cultural spaces, for example, temporary shows and exhibitions occupy public open spaces (e.g. plazas). Pop-up infrastructure, such as kiosks and ‘on-wheels’ initiatives, are another way to rapidly and easily extend services to underserved areas without having to go through the process of acquiring land or commercial space. These initiatives should, however, be supported by parallel long-term planning schemes for permanent infrastructures.
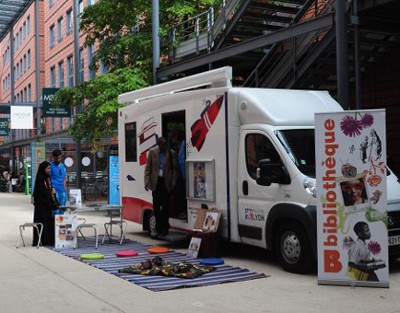
Open-air library
Open-air cinema
In Milan, the Territorial Government Plan (PGT) 2030 identifies, for example, a network of pedestrian areas are planned where implementation of ‘traffic calming’ measures and urban care are designed to improve quality of life aspects, both from the environmental and social points of view. The network is conceived as a supporting structure of collective urban life in the center of neighborhoods, with the aim of facilitating the establishment and functioning of small businesses, crafts and creative activities and the connection of socio-cultural and community services.
In conclusion, in this moment of emergency the main actions will be concentrated within the neighborhoods and in the connections between them. This will ensure sufficient accessibility to essential services and in facilitating the reactivation of commercial and recreational activities, both indoors and outdoors, allowing physical activity, cultural, and social events to take place in complete safety.